Single Crystal Alignment
- Overview
- Alignment Before Beam time
- Preliminaries
- White Beam Methods
- MonoChromatic Methods
- Al Bragg peaks
Overview
The main purpose of Alignment is to know the orientation of the crystal with respect to the neutron scattering instrument which is known as the laboratory frame. has a finely pixilated detector array, covering large regions of the scattering angle (2θ) and azimuthal angle.
Figure 1 illustrates the canonical scattering diagram for .
This view is as if one is looking downward on the instrument from above the sample position. The sample position is where Ki, Q, and Kf meet. Ki and Kf are the incident and scattered wave-vectors respectively. Q is the wave-vector transfer. The detector positions are illustrated with the large semi-circle. The scattering angle is shown as 2θ, and the angle Q makes with the ‘horizontal’ axis of this diagram is θ. In this figure, the location of the instrument beam-stop is where the incident wave-vector intersects the detector array.
A very common misconception is that the measured Bragg peak in the detector view of the instrument is the actual Q vector. This is not the case. The peak may be due to satisfying the Bragg condition for a particular Q, but the vector from the peak position to the sample is the final wave-vector, Kf.
The top panel of Figure 1 shows the location of Q for Kf scattering to the ‘left’ of the beam-stop, and the bottom panel shows the location of Q for Kf scattering to the ‘right’ of the beam-stop.
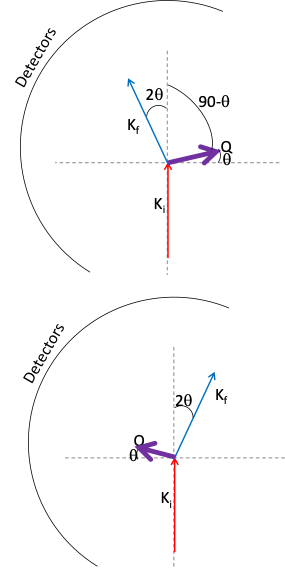 |
| Figure 1. The canonical scattering diagram |
More specifically the x,y, and z components can be written for Q as
| Qx | = -Kfsin(2θ)cos(α) |
| Qy | = -Kfsin(2θ)sin(α) |
| Qz | = Ki-Kfcos(2θ) |
where α is the azimuthal angle. THis is the frame of the instrument also known as the laboratory frame (Qlab). The physics of interest is related to the orientation and reciprocal lattice of the crystal. One needs to transform between the two coordinate systems. The transformation from reciprocal lattice units (r.l.u.) to an orthogonal system in units of Å-1 can be done by a simple matrix multiplication, using a matrix called B, whose elements depend on the unit cell lengths and angles. The result of this multiplication is a reference frame rotated by a matrix U with respect to the laboratory frame. If a crystal is placed in the instrument at the sample position one needs to determine the orientation of the crystal with respect to this laboratory frame. Such an approach for dealing with crystal alignments are called the UB formalism and were first introduced by Busing, W. R. & Levy, H. A. (1967) Acta Crystallographica 22, 457. This formalism also works for spectrometers and its application to Triple Axis Spectrometers and Direct Geometry Spectrometers is described in Lumsden, M. D., Robertson, J. L. & Yethiraj, M. (2005). J. Appl. Cryst. 38, 405-411. and its specific application to DGS instruments at SNS is described in A. T. Savici
If the instrument contains a goniometer to rotate the sample, an additional rotation matrix is multiplied before U for each rotation axis. For Direct Geometry spectrometers, usually only a rotation around the vertical axis (ω) is supplied. So to go from Qlab to h, k, l the matrices are ΩUB. Similarly to go from an h, k, l vector to a vector in the Qlab one simply applies (ΩUB)-1
For direct geometry spectrometers, it is assumed that the unit cell parameters are known. The main goal is to find U, the orientation of the crystal with respect to the Laboratory frame. Therefore an alignment can be done with only a few reflections, though more reflections provide a better understanding of the alignment. This can be done in multiple ways.
Also often examining the U matrix does not give an intuitive feel for the crystal orientation. An alternative way to represent the crystal orientation is by using two vectors in the horizontal plane denoted as u and v. The vector u is the one along the incident beam (z) and v is perpendicular to it at 90 degrees.
Alignment Before Beam time
The user should have a pretty good idea of the crystal alignment before the experiment. If it is a multi crystal array, the crystals should be aligned one to the other and the alignment of the array known with respect to the mount. Typically the crystals are aligned with and xray or neutron diffractometer. The user can request access to the xray backscattering Laue Machine or the 2 axis alignment station available at ORNL for some alignment time. Talk to your local contact months in advance of the beam time to schedule it.
Preliminaries
Prior to mounting the sample, it is very helpful to have a sketch of its spatial extent with dimensions.
This will help to determine if the incident beam slits are at appropriate locations.
When mounting the sample within an exchange gas can, please note the height of the sample center relative to an external mounting fixture of the can. This will help ensure that the sample is mounted at the beam center.
When mounting the sample within an exchange gas can, please also make marks on the outside of the sample can indicating the directions of one or two reciprocal lattice vectors. These marks must then be transferred to the outside of the sample environment.
Knowing the location of these vectors will help to speed and verify the alignment process.
For the alignment, it is necessary to have the lattice parameters and a calculated list of Bragg peaks with the values of H, K, L, d-spacing and relative intensity.
Having this already prepared will be very helpful. Including values of scattering angle (2-theta) for a particular incident energy, for example 30 meV (1.651 Å), is also helpful. The ICSD (Inorganic Crystal Structure Database) is available from the analysis machines to find this information (see the structure information page for more details).
White Beam Methods
Because ARCS and SEQUOIA are located on a straight guide section, one has the option of moving the Fermi choppers out of the beam and operating the instrument with a quasi-white beam of neutrons. These instruments then operate as large Laue cameras. Below are instructions of how to set-up and perform this type of measurement. Please note that the white beam will rapidly activate the sample.
If this is a concern, the local contact will help to minimize these levels by only opening the primary shutter and exposing the sample to the white beam when it is necessary.
Please also note that SEQUOIA has a larger bandwidth than ARCS such that frame-overlap can make a white beam measurement confusing.
For SEQUOIA, it may be preferable to use the T0 chopper in phase with the source, but no Fermi chopper. One can set the T0 chopper to the energy appropriate to satisfy the Bragg condition for the peaks of interest.
Often it is useful to watch the alignment marks you made on the top of the CCR using the sample area camera.
The steps below describe how to establish white beam operation and how to acquire a Laue pattern.
- Put in White beam mode
- Take 0.02 C of Data at an angle
- Take 0.02 C of Data at ω 90 degrees away from the first angle.
- Take additional angles if you feel they are necessary
Analyzing the Laue Data in an automated way
If it is a nice single crystal and there is only a little Al in the beam, an automated script can be used to determine the U matrix. Discuss such a script with the instrument staff.
After running this script, we advise that you check a peak or two by using the CSS alignment tool.
Analyzing the Laue Data in a manual way
Otherwise Use MantidWorkbench to select the peaks by hand and then determine the U matrix. To do this by hand,
- Load the Data into MantidWorkbench
- Convert the Units on the Data to Dspacing
- Open the data in instrument view.
- restrict the D spacing region to something like 0.5 to the the largest d spacing in the system.
- Select the peaks you want to use to determine the alignment
-
Run the FindUBUsingLatticeParameters
- Enter the lattice parameters
- Start with a Tolerance of 0.2
- Run the Algorithm. If the number of reflections to be indexed is too small then increase the tolerance. If the increased tolerance gets unphysically large than you probably do not have a single crystal sample.
- Run Index Peaks
- Use SaveIsawUB to save the matrix
To get the u and v vectors for subsequent software:
- in the Ipython Terminal type
h = mtd['SingeCrystalPeakTable'] - Type
OL = h.sample.getOrientedLattice() - Type
OL.getuVector() - Type
OL.getvVector()
Next you should do a check with the CSS Alignment tool to be sure the Alignment is correct.
MonoChromatic Methods
For CNCS and Hyspec Monochromatic methods are necessary for crystal alignment.
Often Monochromatic alignment is useful for ARCS and SEQUOIA too if a multi array of crystals has multiple peaks or if Al powder lines are in inconvenient locations.
For all the spectrometers using the multi angle scans of Inelastic data to improve the alignment after it has been acquired is another use of the monochromatic methods
The CSS Alignment Tool
- In CSS open the Crystal alignment tool.
- Be sure you are on step 1 (setup) in the left of the screen
- in the right of the screen, enter the lattice parameters
- in the U and V vectors, enter the u and v vectors.
- click Set starting UB
- click next it should move to step 2 (Peak list in the left) in the workflow
- Enter h,k, l limits to calculate a peak list
- Click Calculate Peak list. A list of possible Bragg peaks will be provided to the right of the screen. Note that since symmetry operations were not entered, some of these peaks may be systematically absent.
Using the Mantid tools for an alignment
Under Construction
Tweaking an alignment with the Mantid tools
Often after doing an over night multi-angle scan the user will see that the definition of the orientation of the crystal with respect to the goniometer needs to be improved. Here are the steps to refine this information.
- Start mantid workbench and load the MDE using LoadMD algorithm
-
Click on the arrow next to the workspace name, so you can read the extents
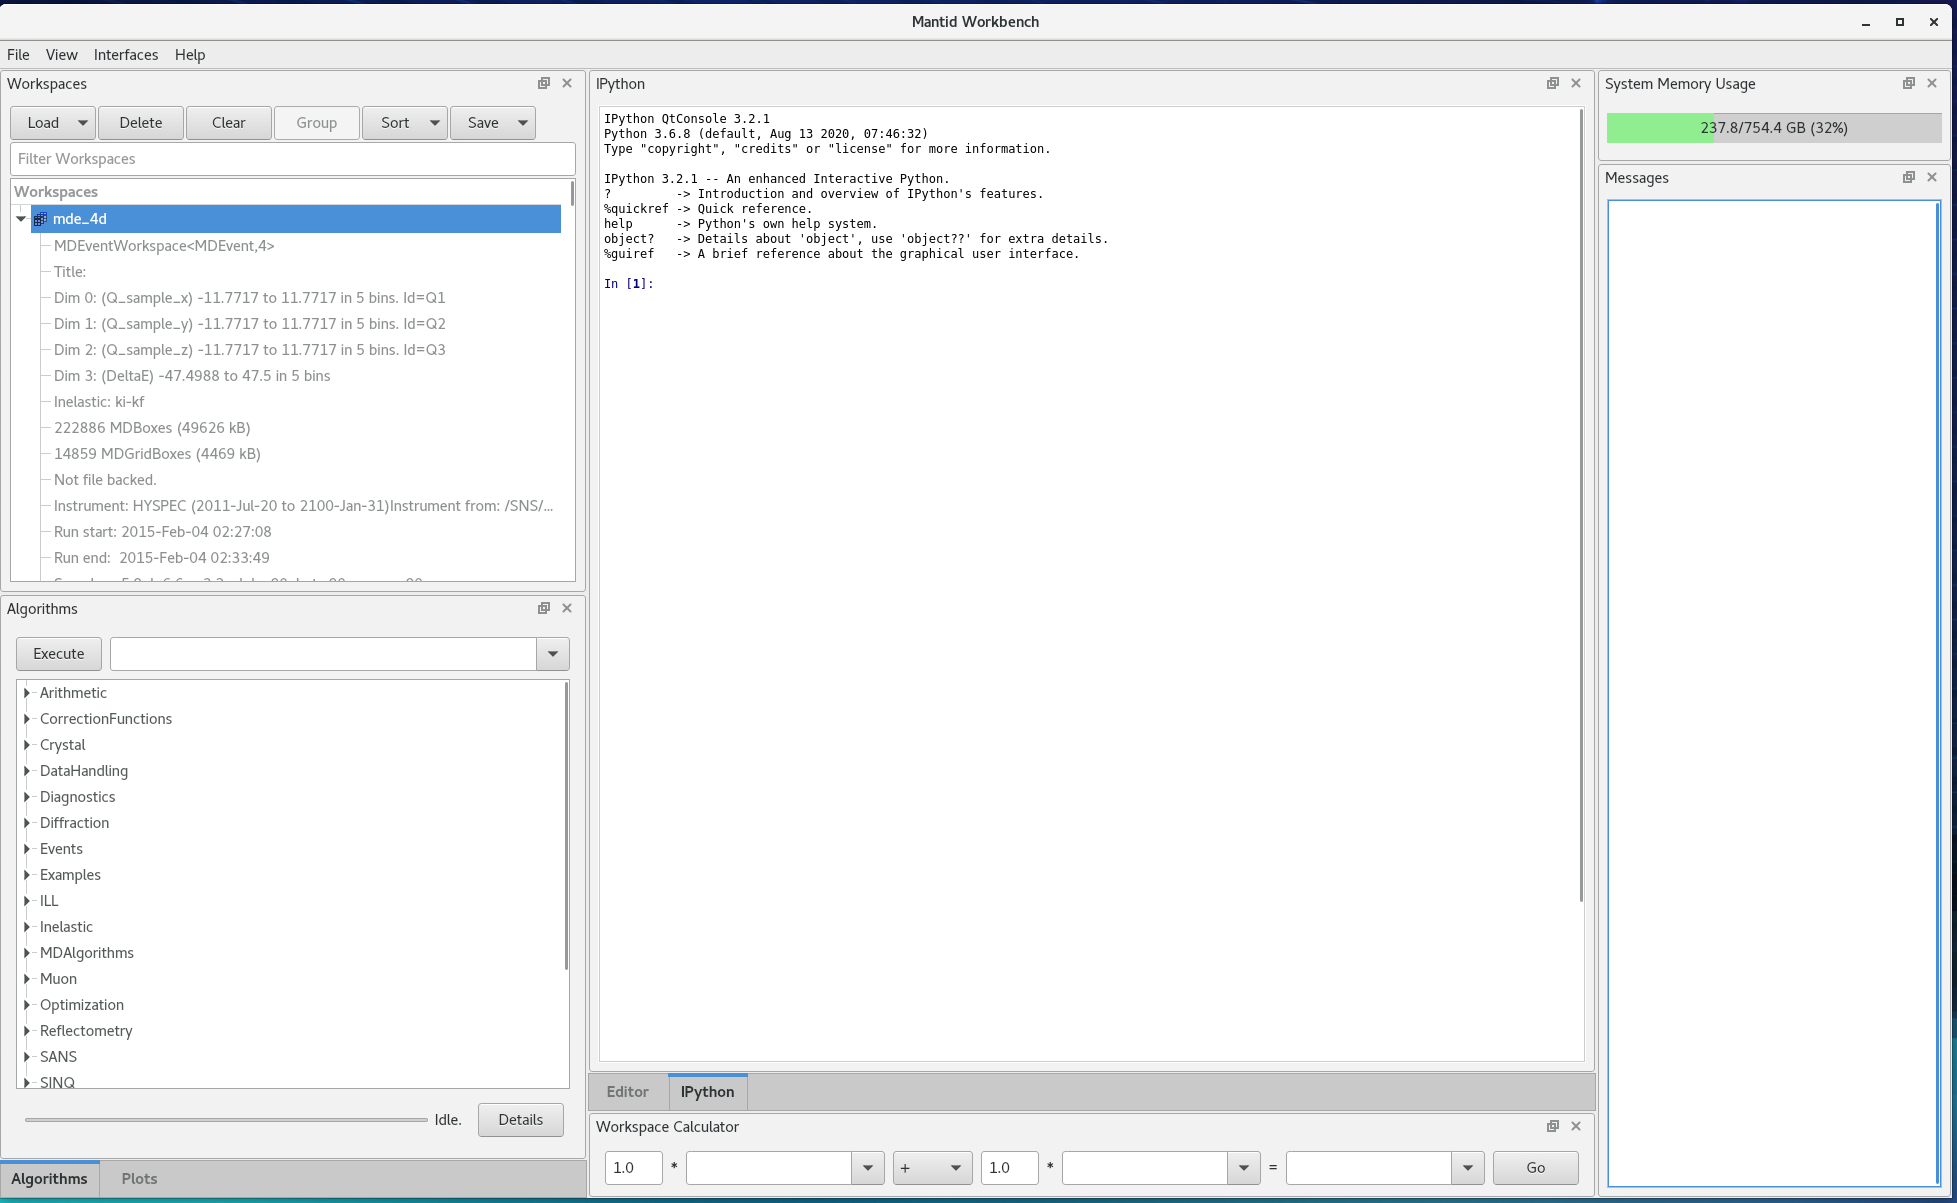
Figure 2. Read the extents of the workspace from the information on the left hand side -
Convert the workspace to a diffraction workspace by integrating the energy direction. Use
SliceMDalgorithm- Keep axis aligned
- Dimensions are Q_sample_x, Q_sample_y, Q_sample_z. The extents and number of bins are from original MDE workspace
- Give a different name
- Make sure the
TakeMaxRecursionDepthFromInputis checked
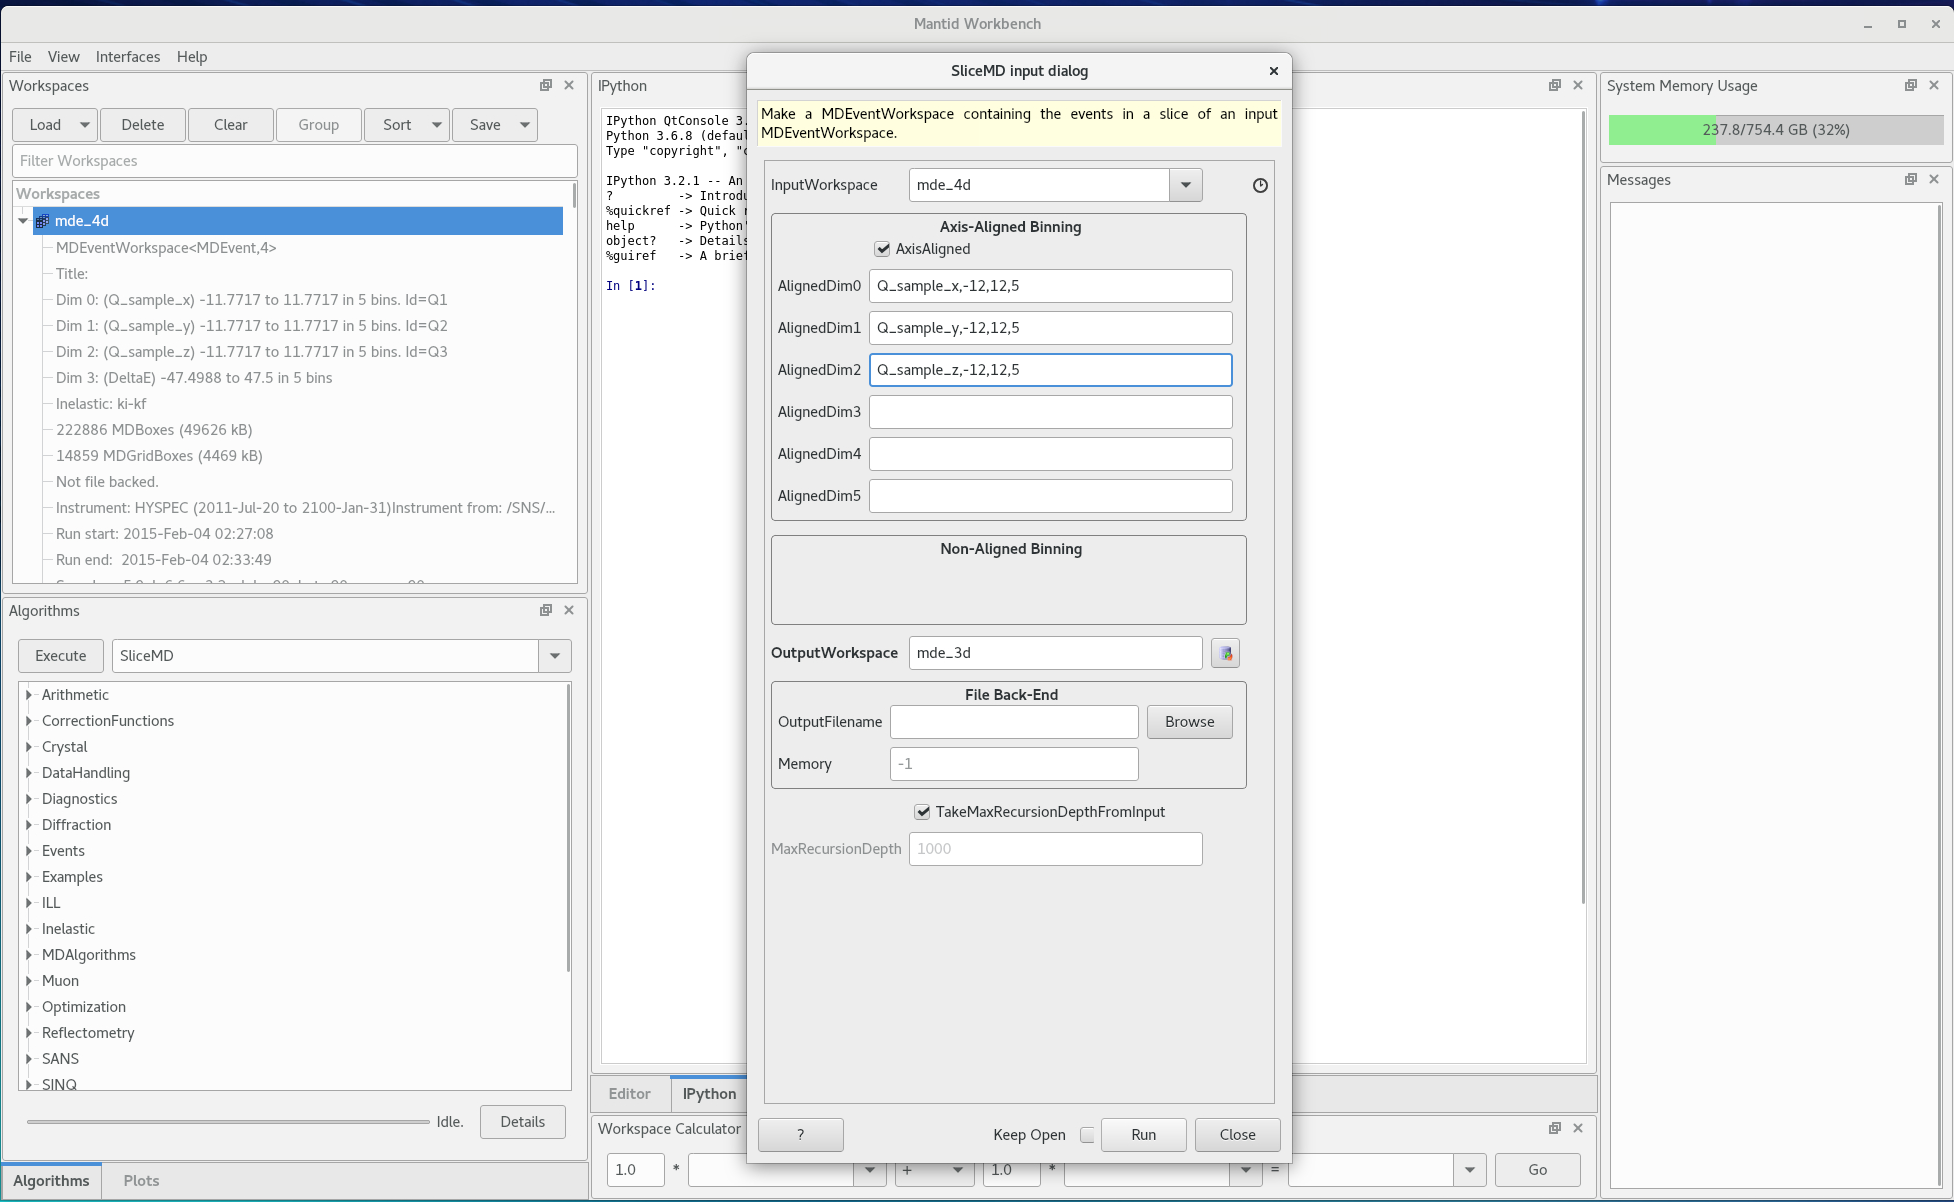
Figure 3. Integrate the energy transfer -
Create a peaks workspace using
CreatePeaksWorkspace- Input workspace is the diffraction MDE workspace
- Number of peaks is 0
- The OutputType should be
LeanElasticPeak
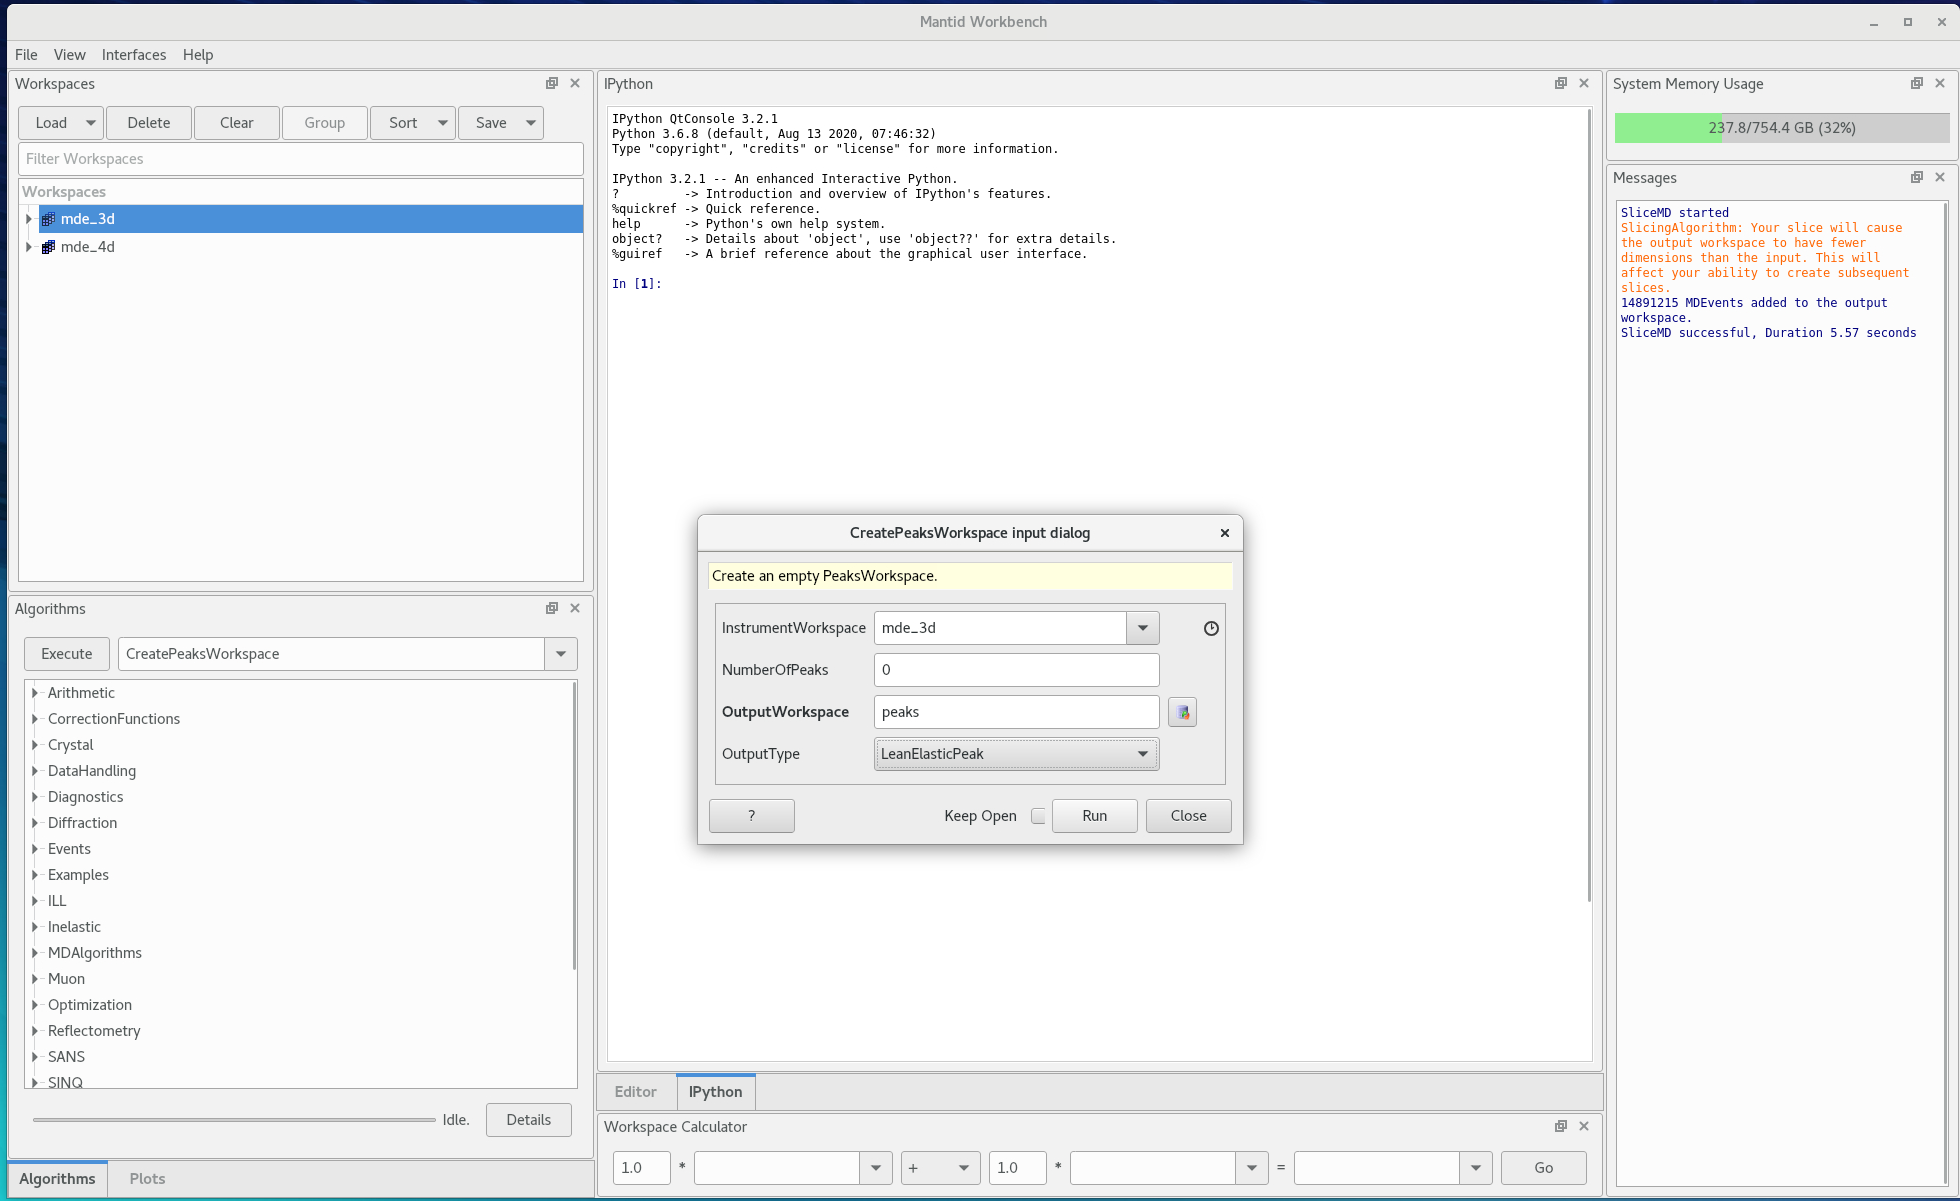
Figure 4. Create a peaks workspace - Right click on the diffraction MDE workspace and show the slice viewer
-
Add the peaks workspace to the view (click on the button with 3 black disks) and choose the peaks workspace you just created
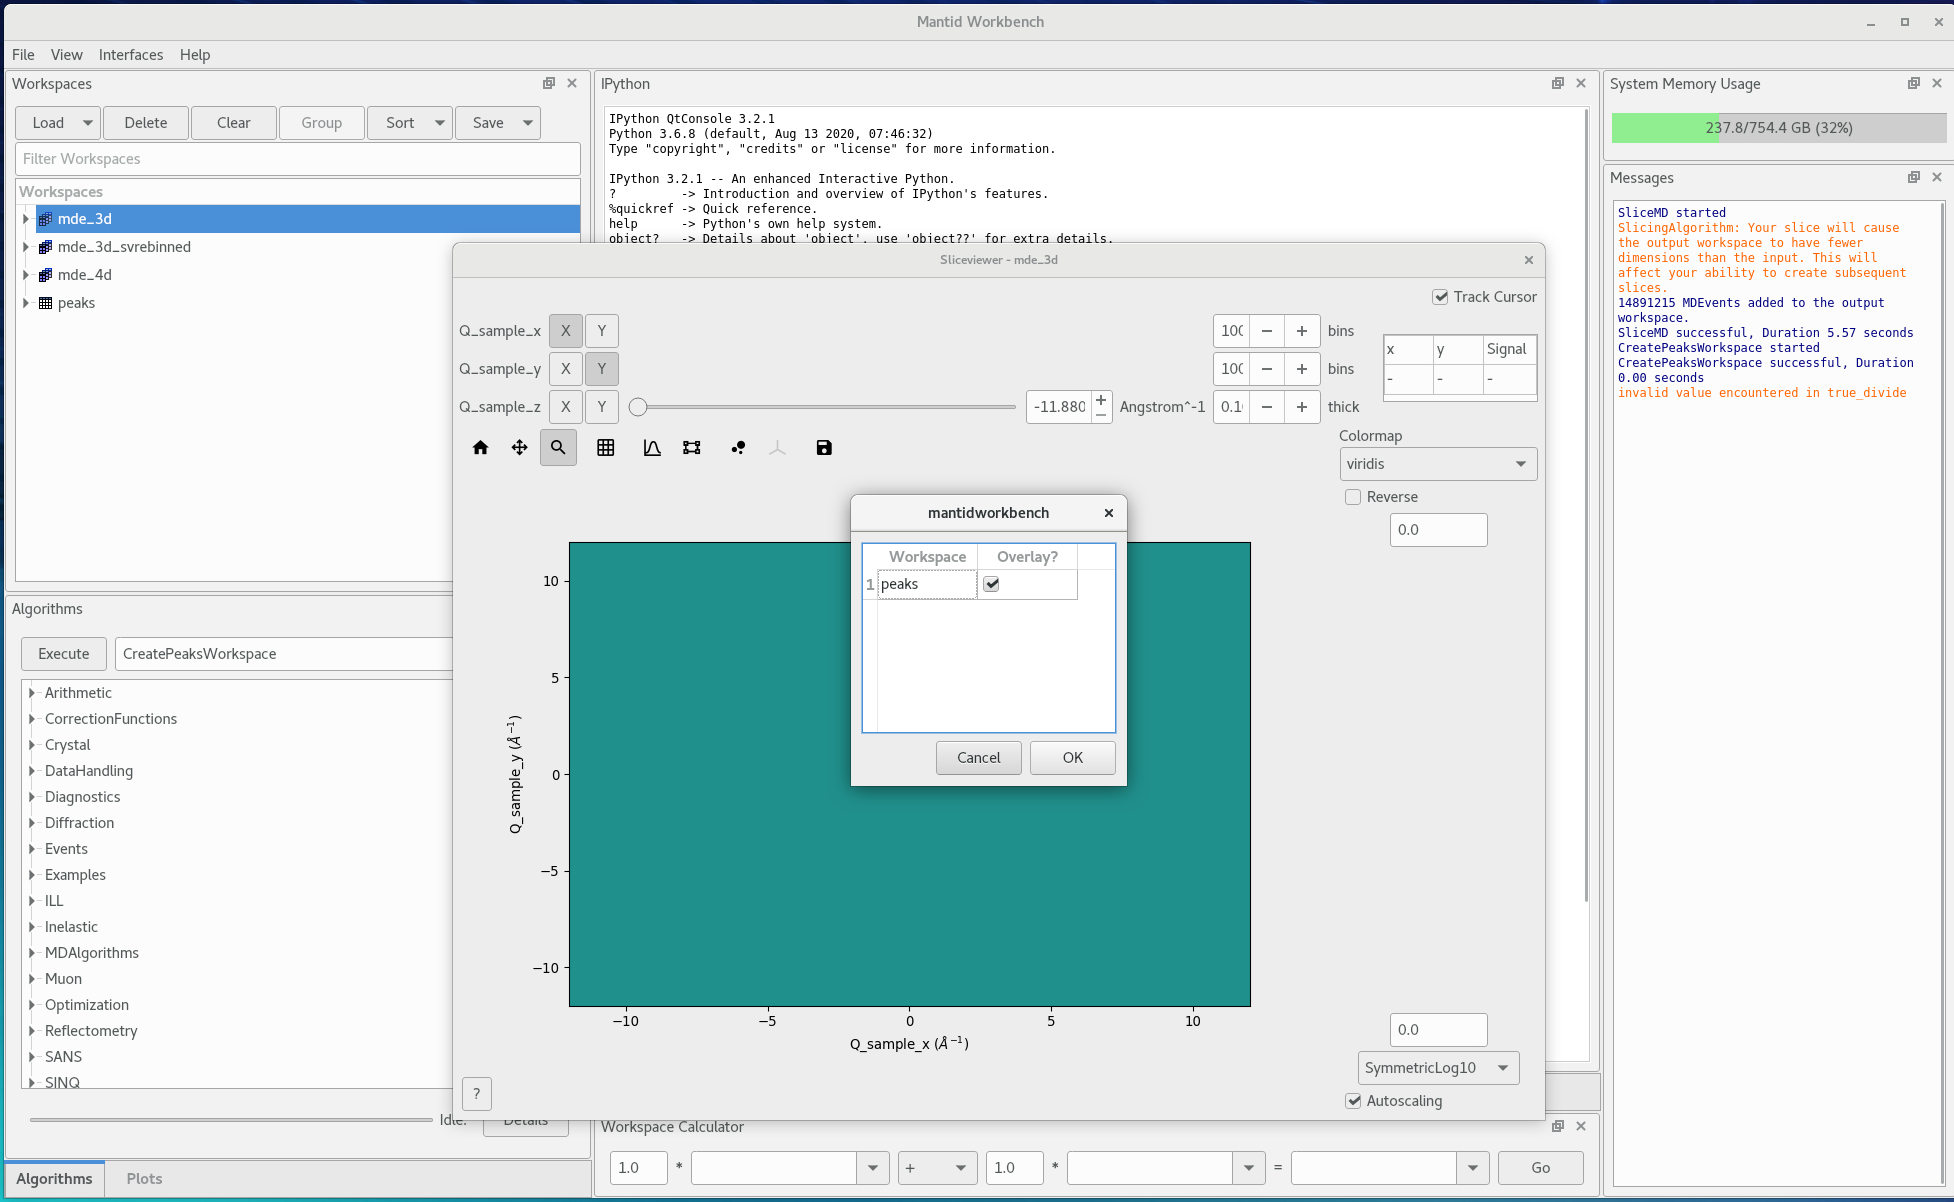
Figure 5. Overlaying the peaks workspace -
Change which axes are on the x and y and which is on the slider. Then for the x and y select the number of bins and the integration range, until you can identify peaks. Note that the horizontal plane in Mantid is the Q_samplez - Q_sample_x, at Q_sample_y=0
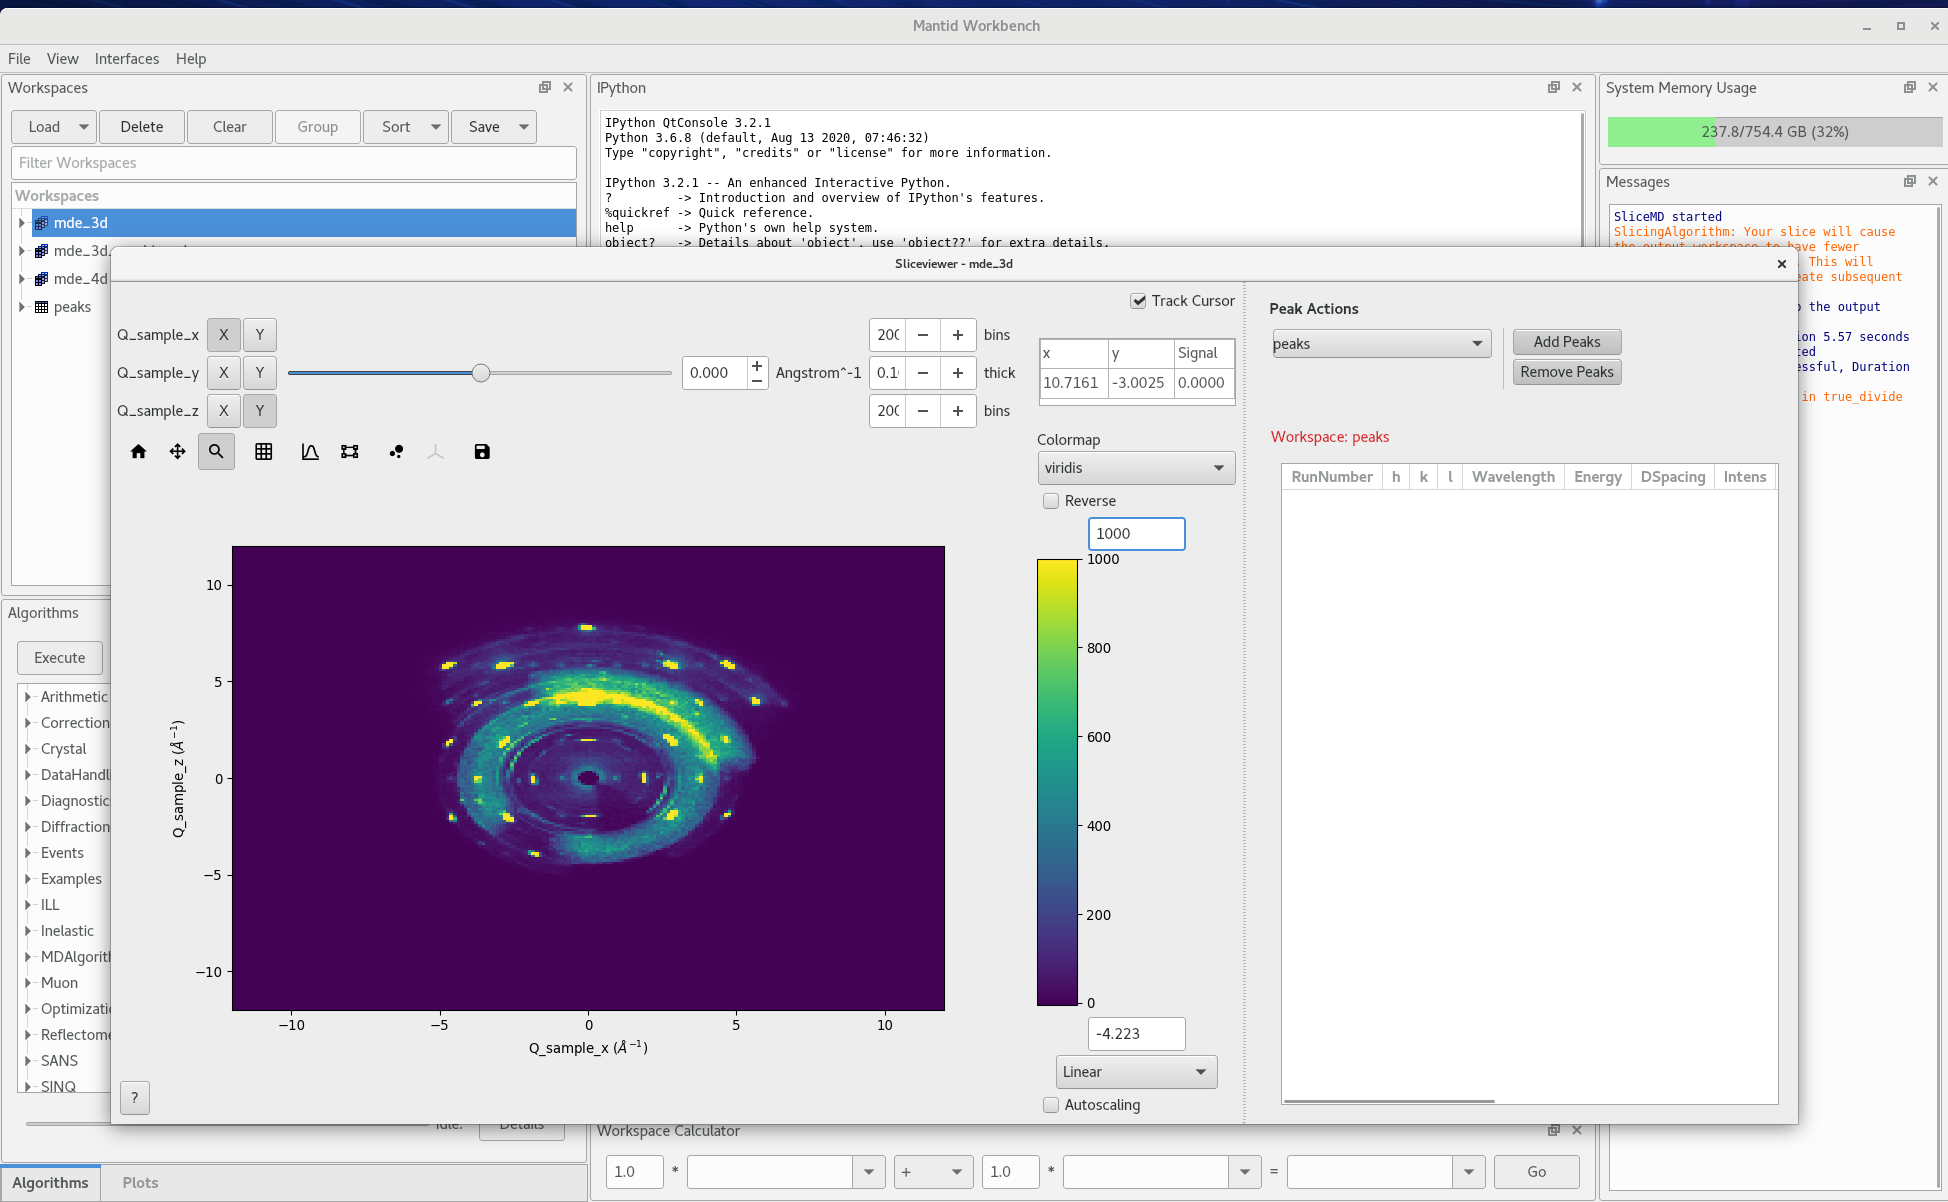
Figure 6. 2D data view -
Click on
AddPeakson the right hand side, then left click on the slice image where you see the peaks.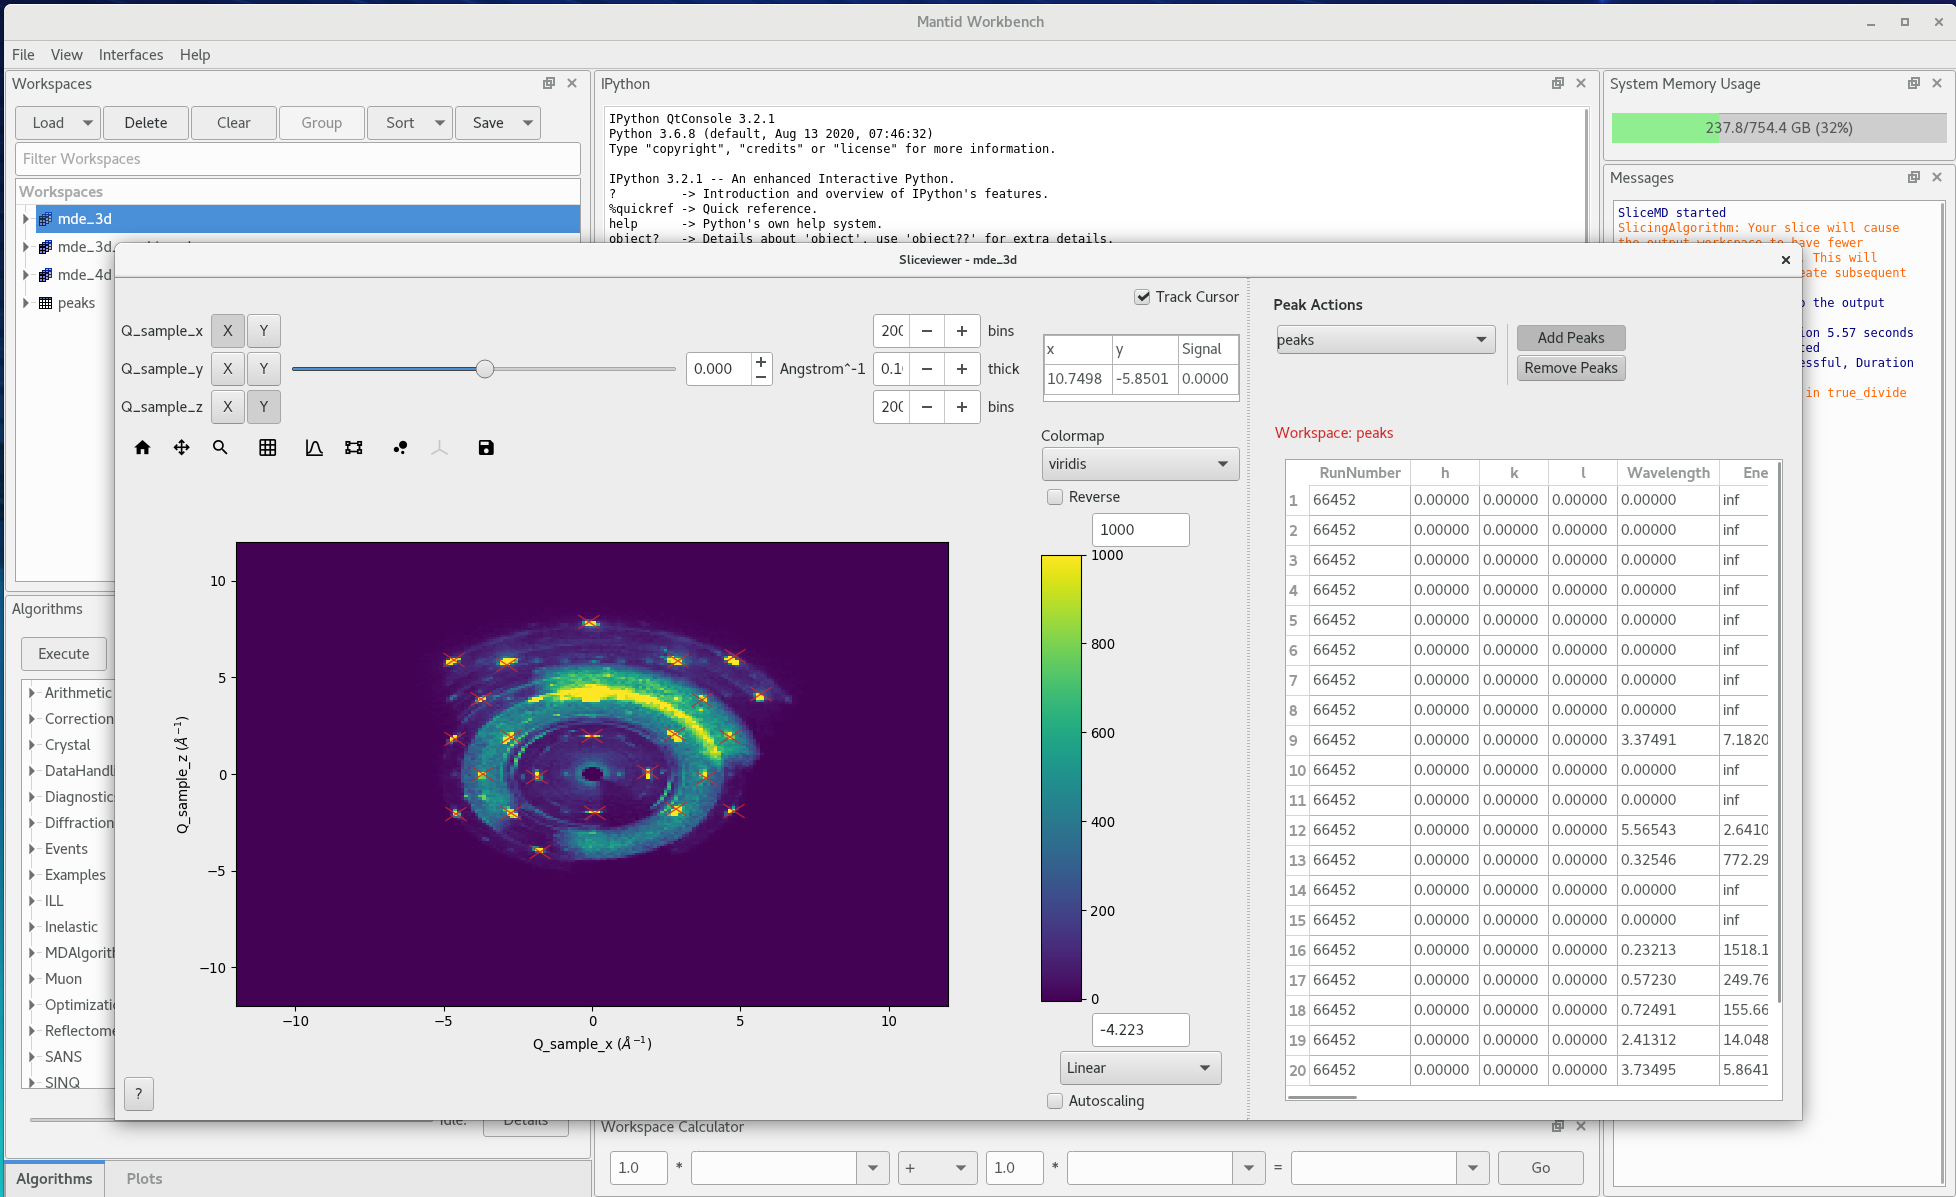
Figure 7. 2D data view with peaks selected for alignment -
Run the
CentroidPeaksMDalgorithm to refine peak center positions in all 3 dimensions.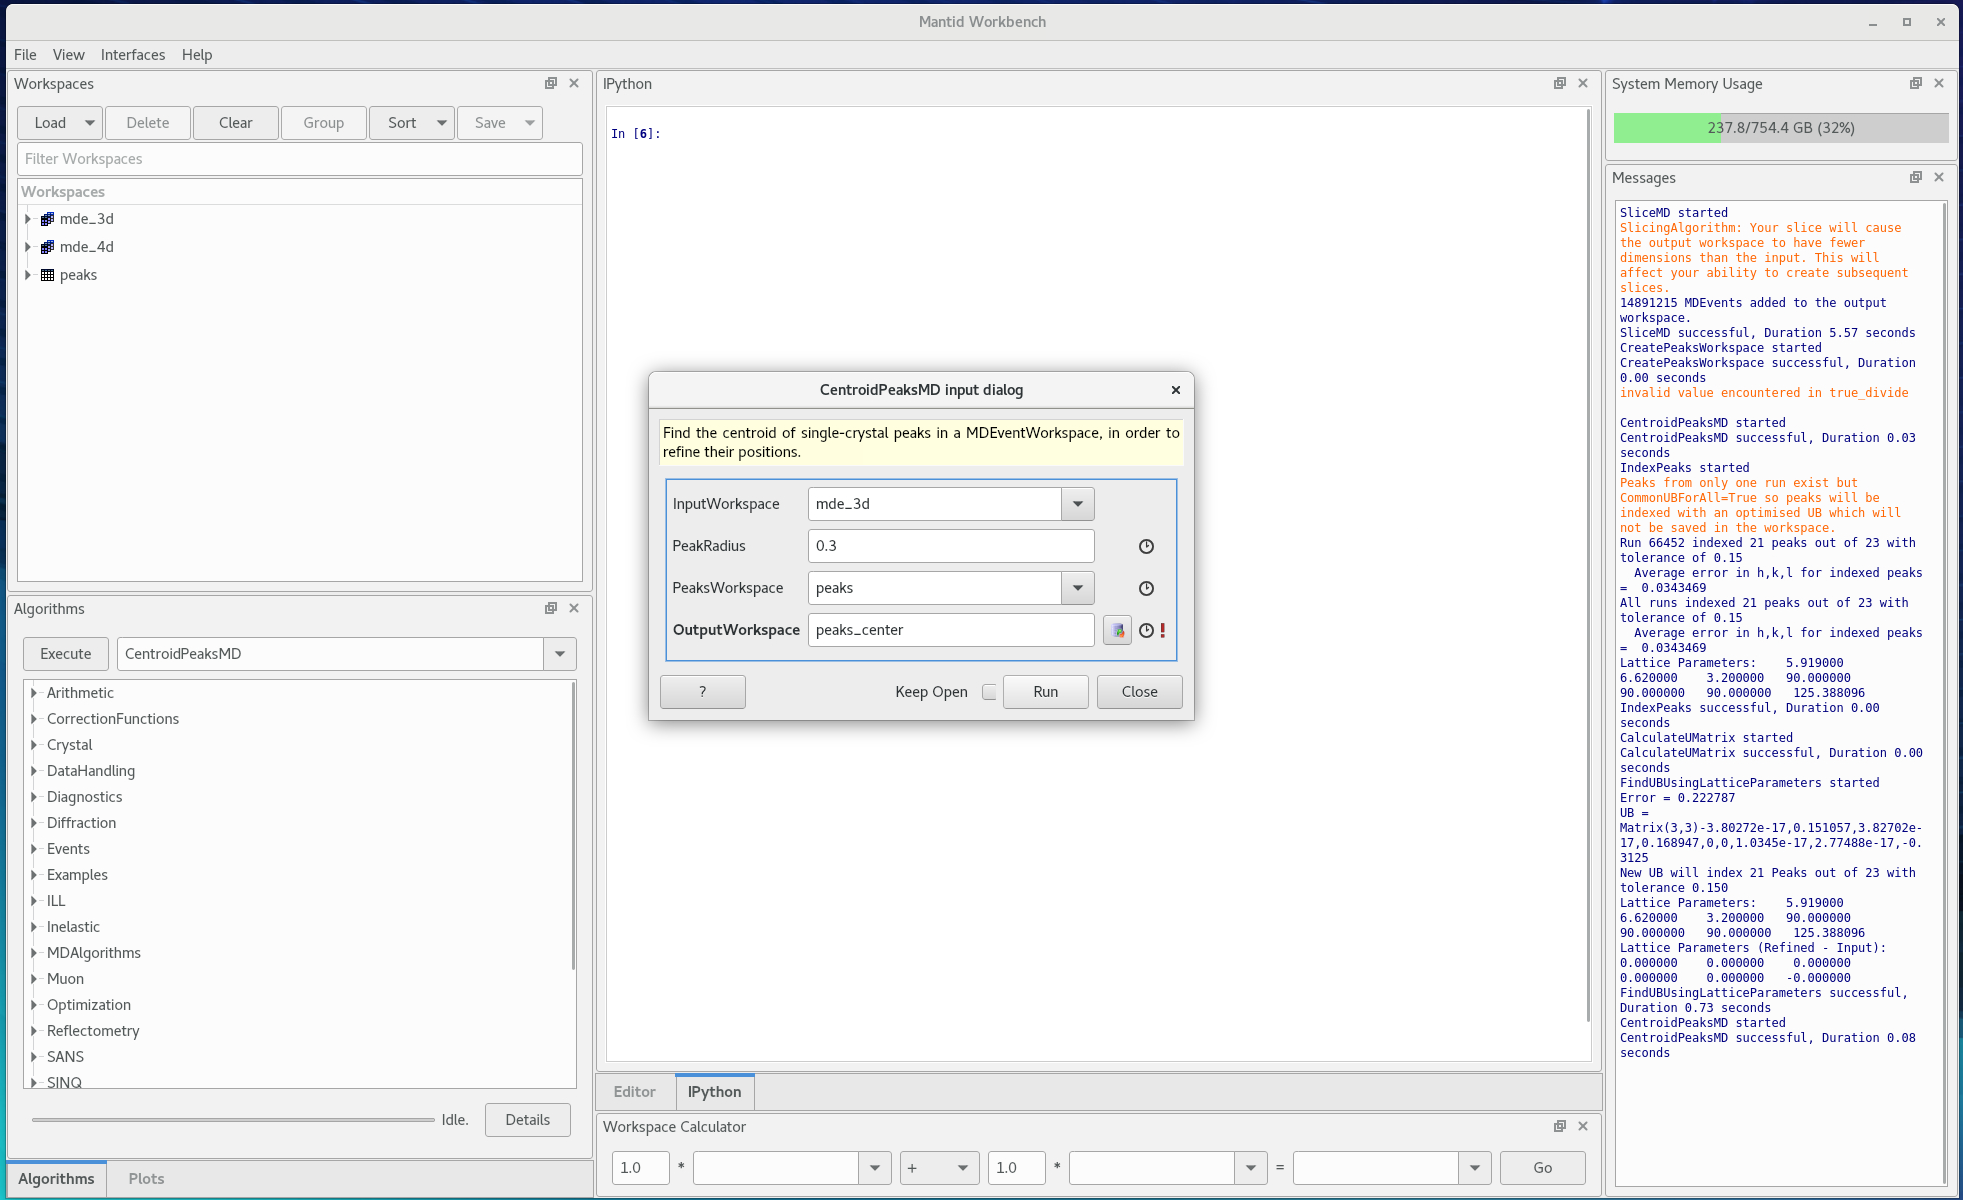
Figure 8. Running the CentroidPeaksMD algorithm -
Find the UB from the centered peaks and known lattice parameters.
- use
FindUBUsingLatticeParameters - index the peaks first with
IndexPeaks, rounding the HKL values, then refine the orientation withCalculateUMatrix
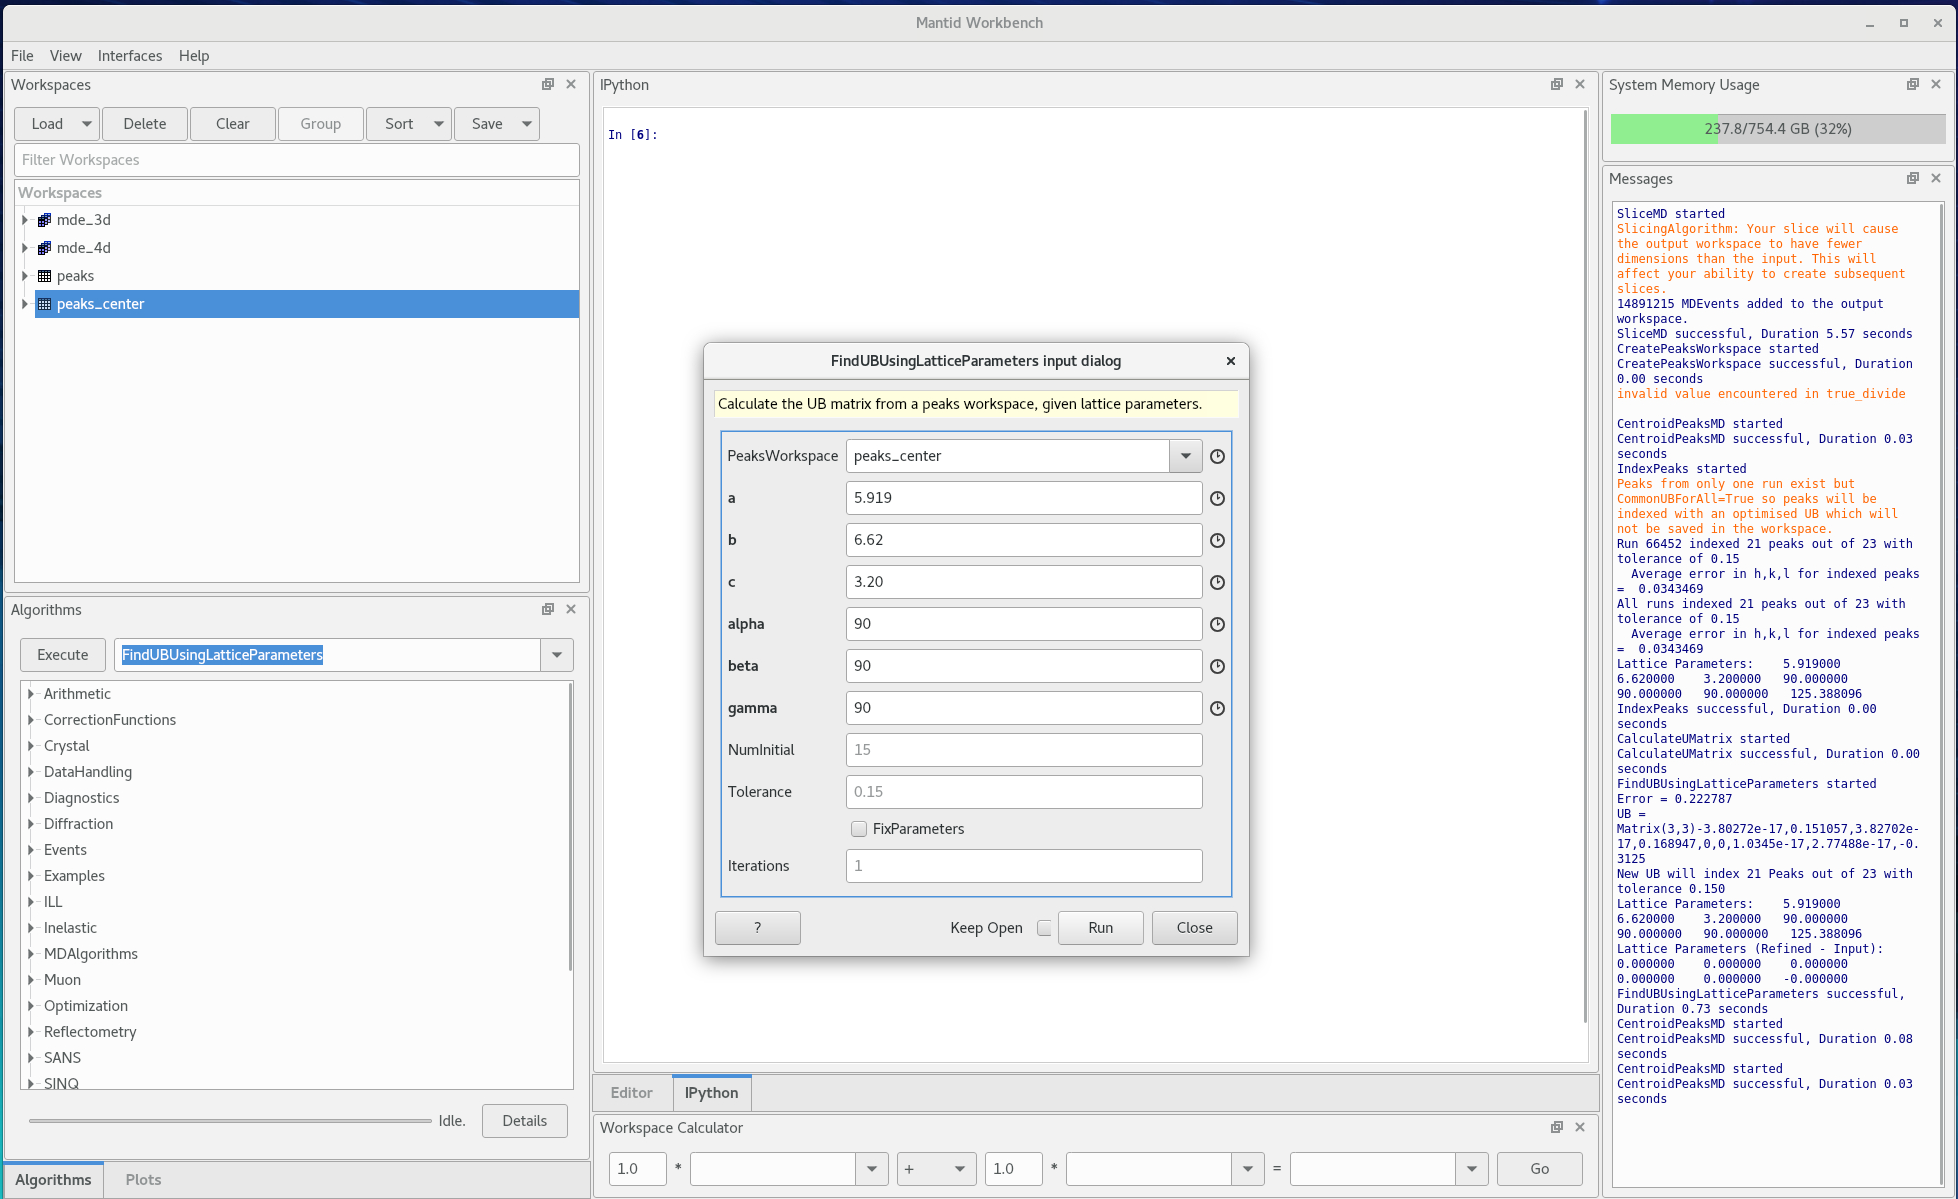
Figure 9. Running the FindUB algorithm 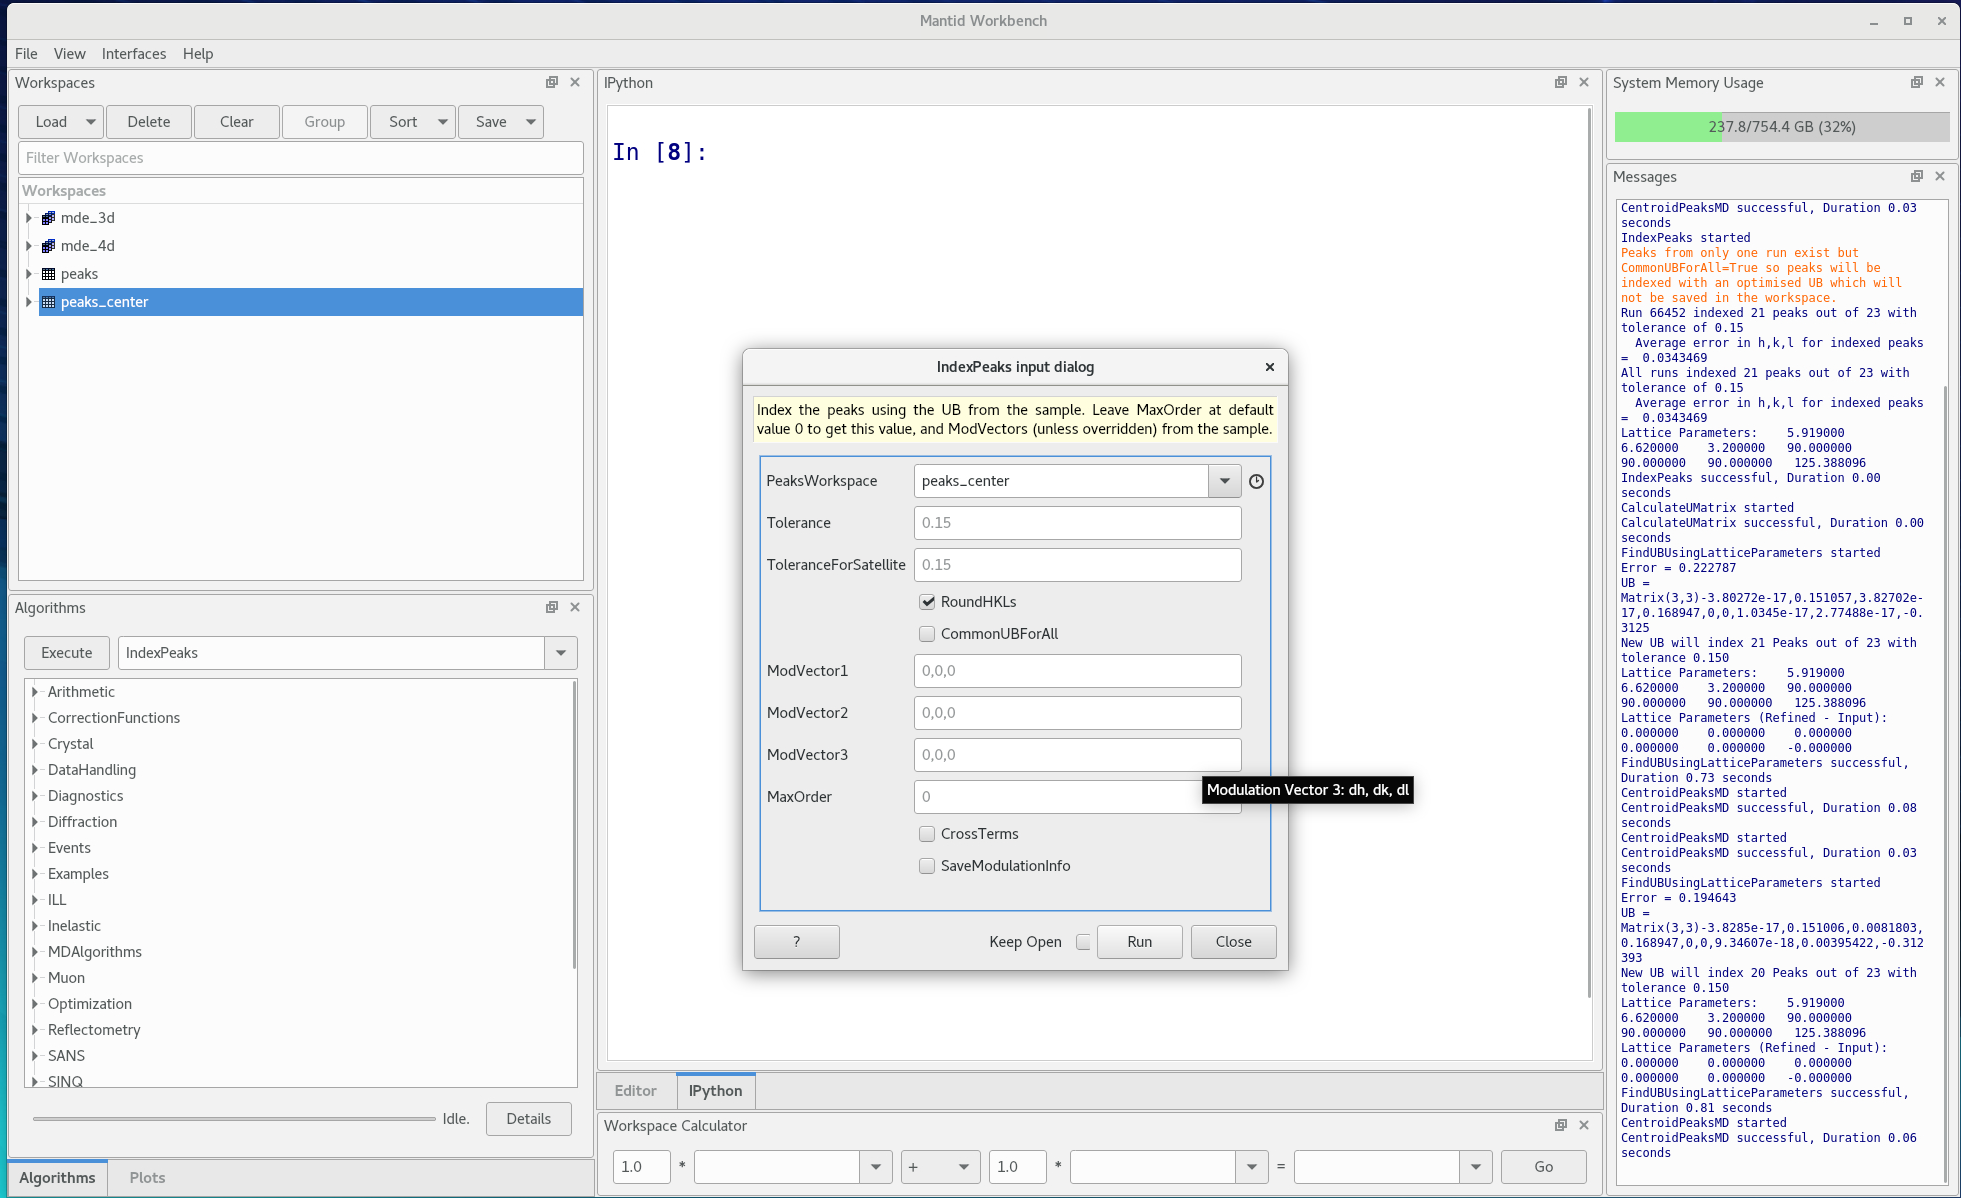
Figure 10. Running the IndexPeaks algorithm 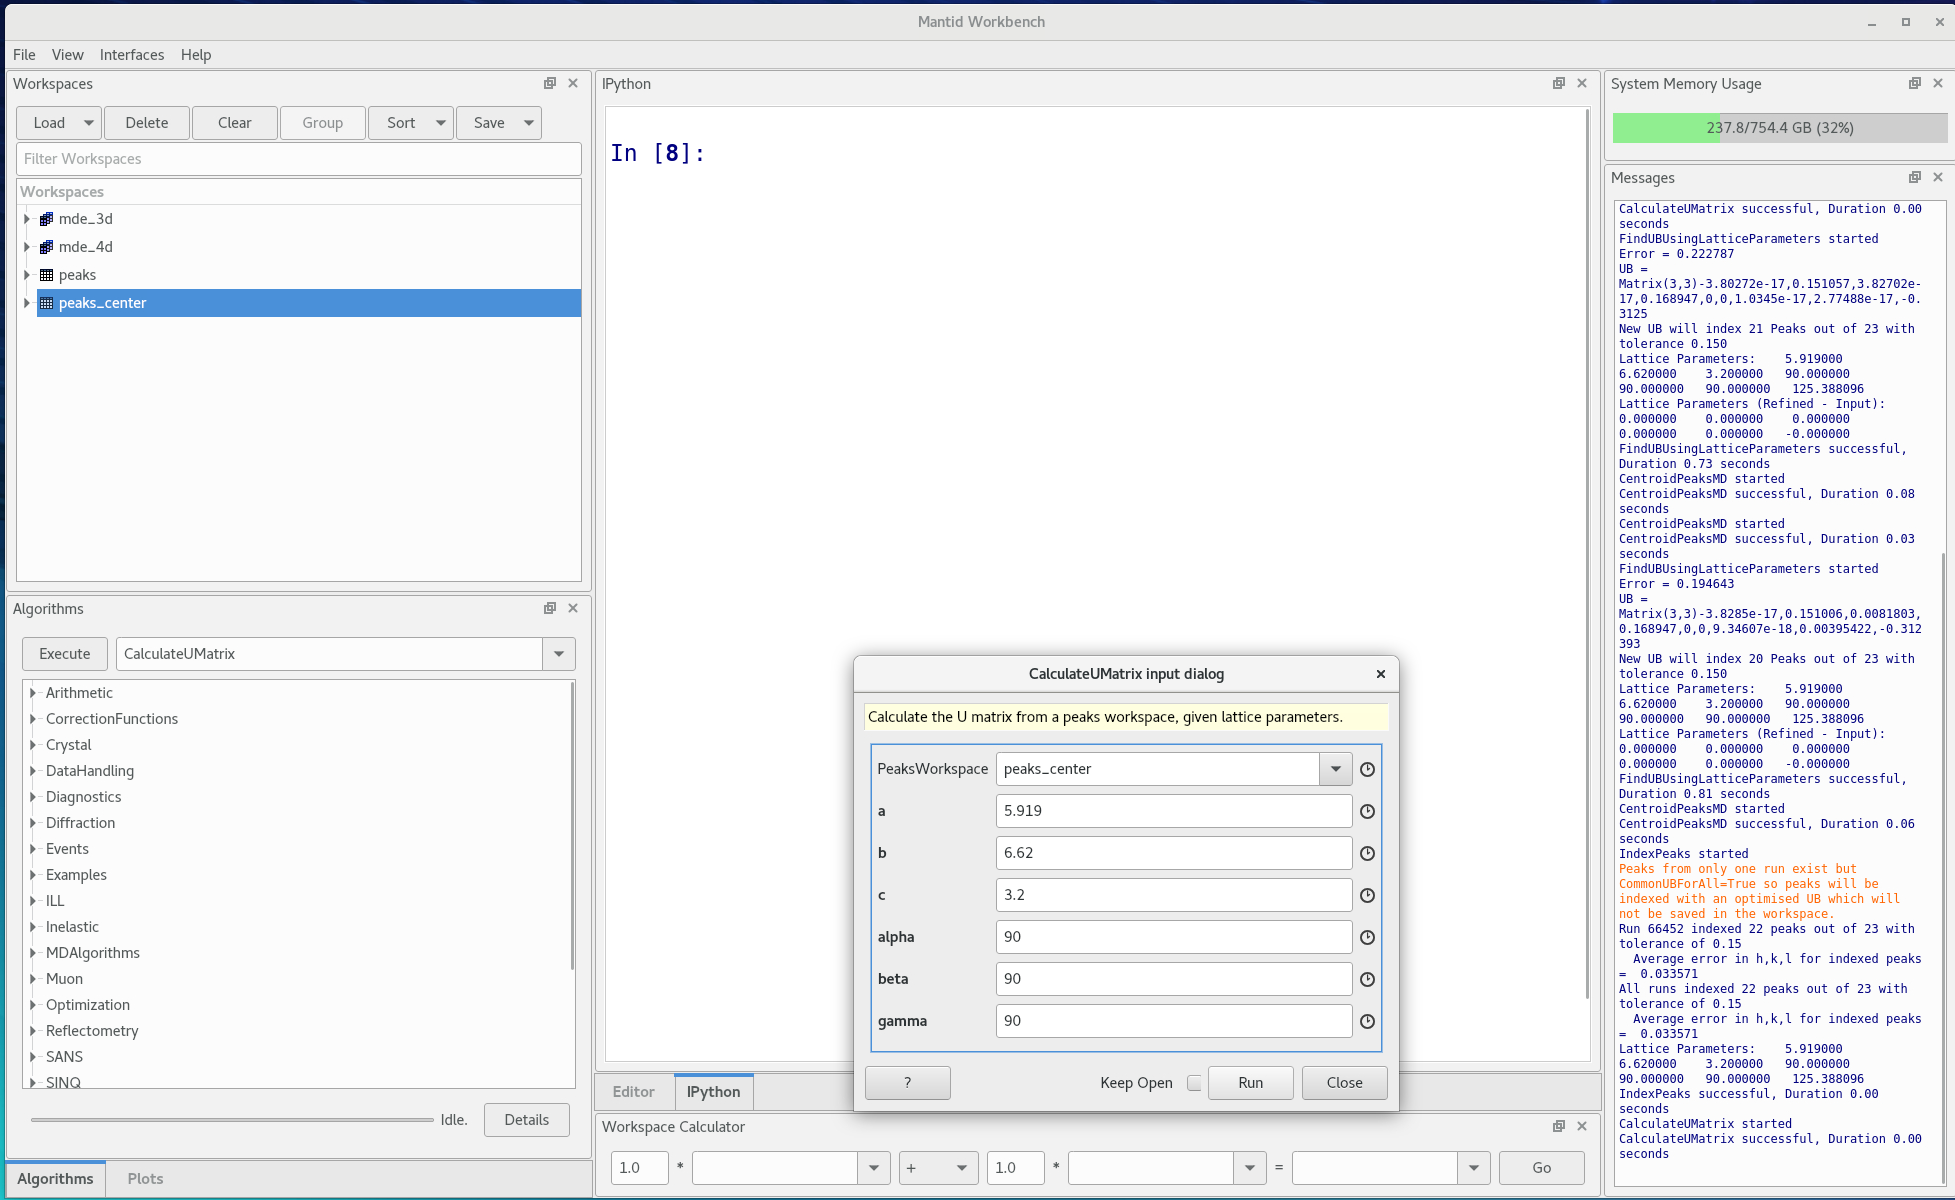
Figure 11. Running the CalculateUMatrix algorithm Note there are other Algorithms for finding UB matrices, but as this is tuning alignment this is the typical workflow.
- use
- One can print orientation vectors in the ipython window
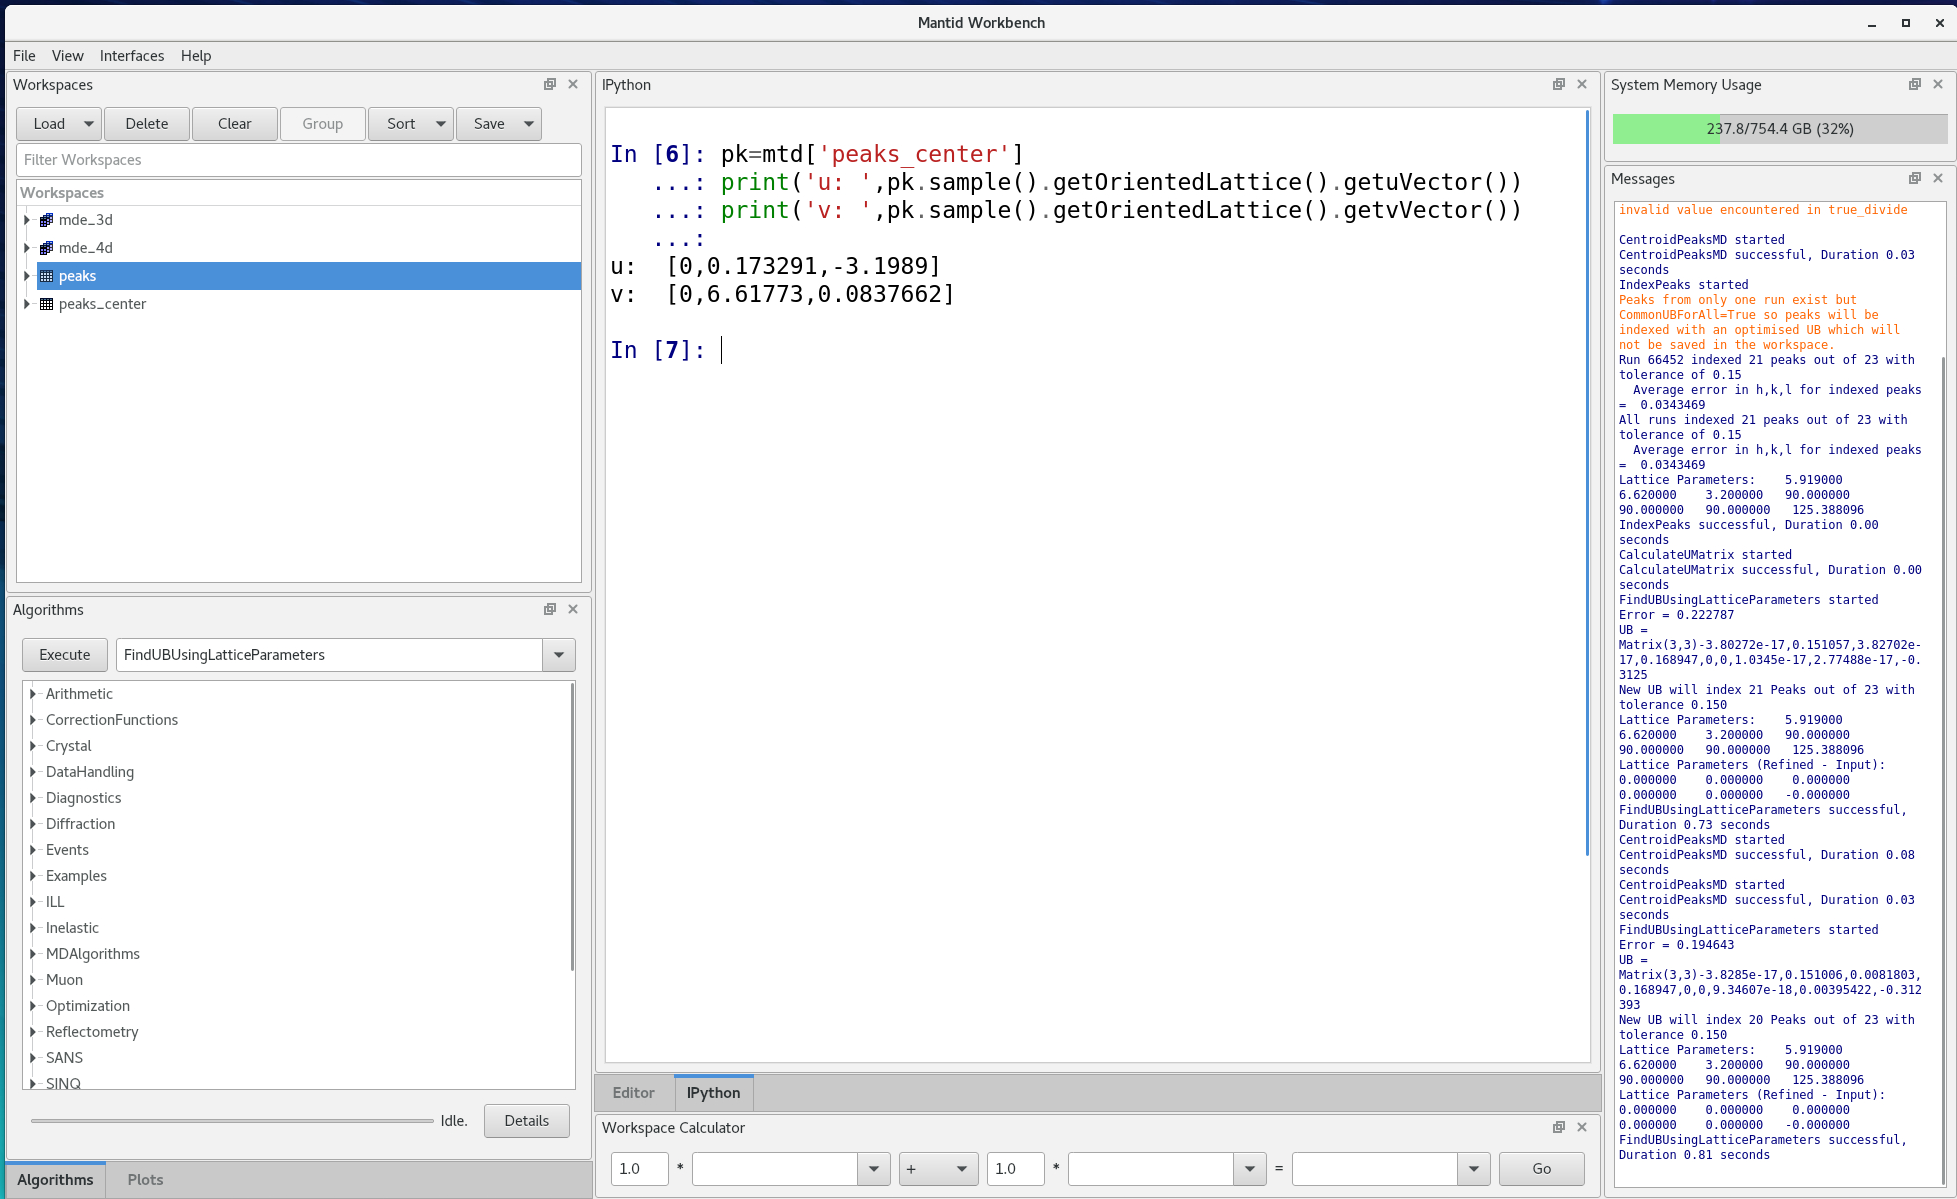 |
| Figure 12. Printing the new orientation vectors |
Al Bragg peaks
Since Al is used to make most holders. It is useful to have its Bragg reflections readily at hand.
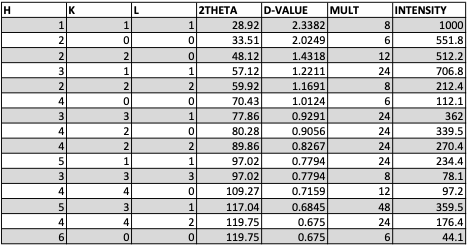 |
| HKL, 2-theta, multiplicities, and intensities for Al Bragg peaks. Values for 2θ calculated at Ei=60 meV. |
