Monitor.sns.gov
Web Monitor
To monitor your experiment go to the website monitor.sns.gov
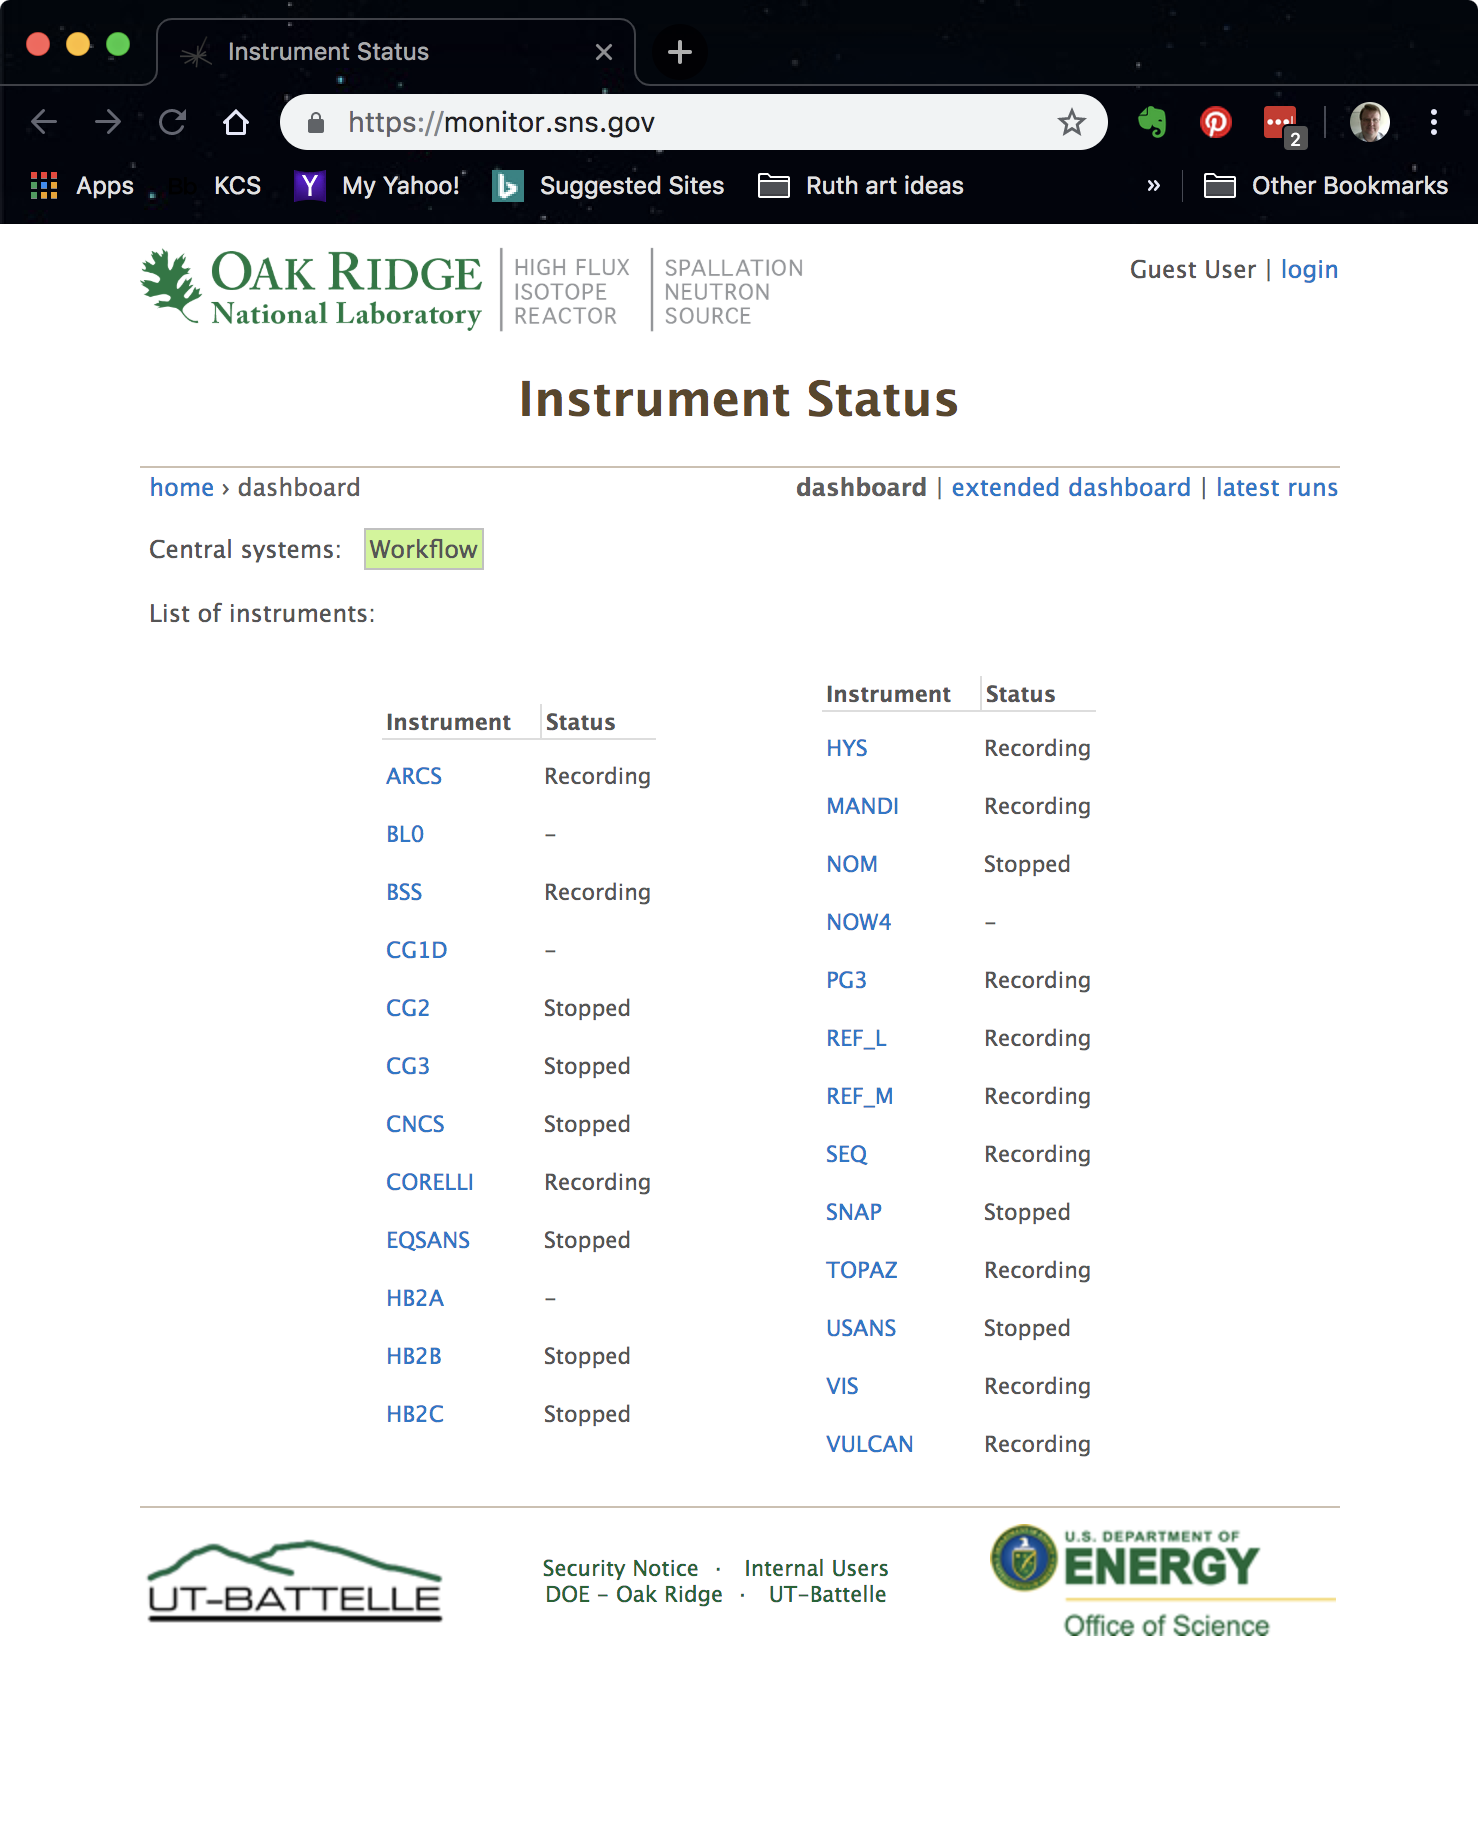
Then select your instrument in this case ARCS.
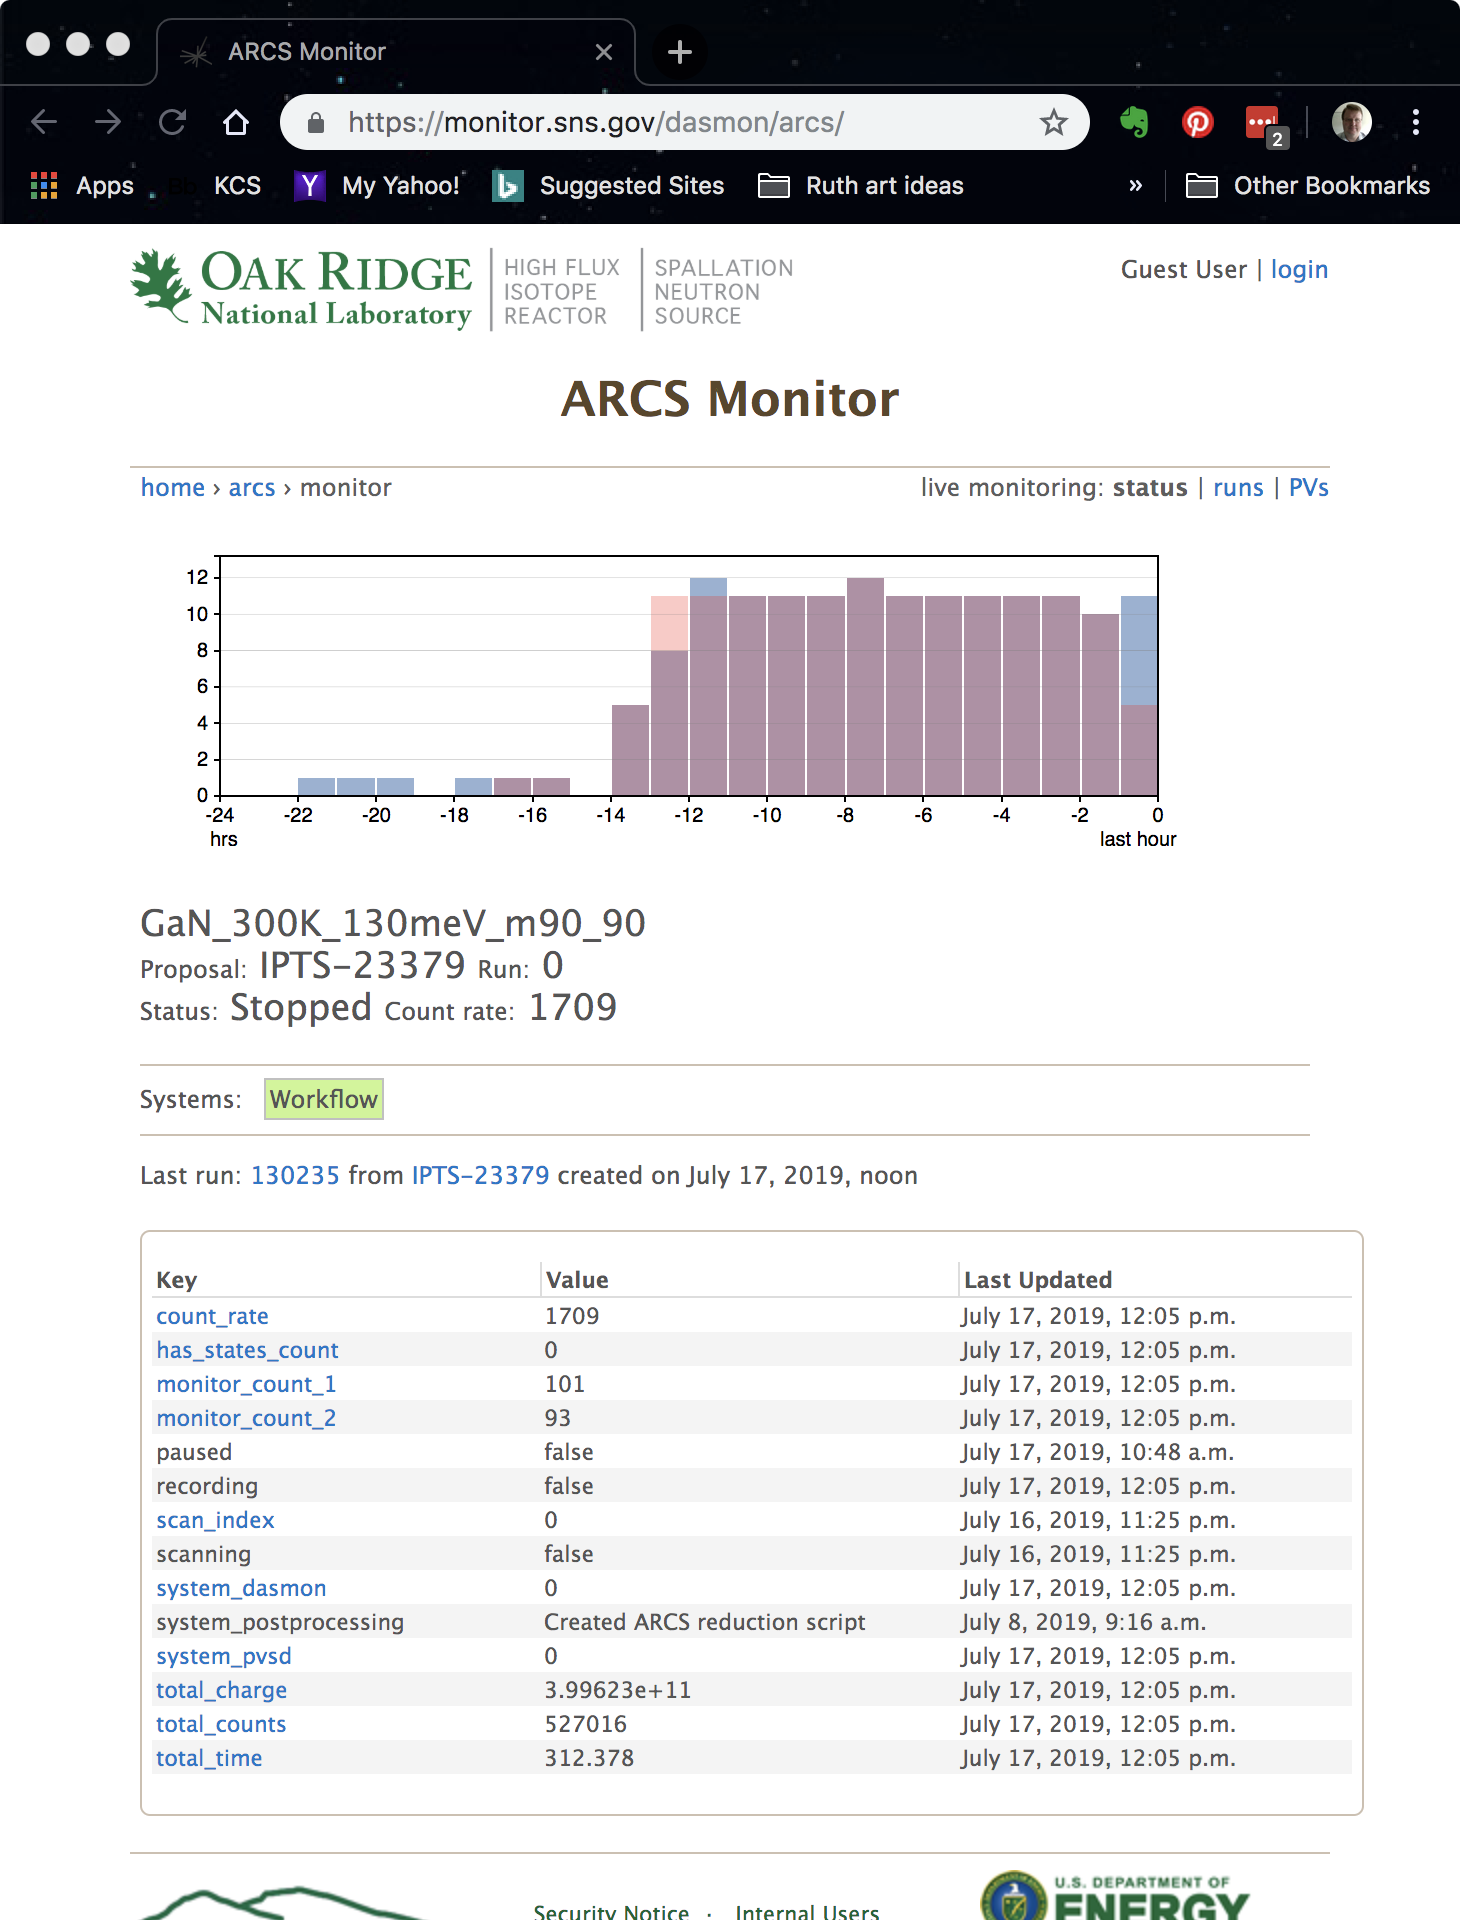 Figure 2. the main monitor page for the ARCS instrument
On this page you see what is currently running on the instrument. The graph at the top shows how many files were successfully processed through the saving -> reduction -> cataloging workflow. Red indicates there were errors. These errors can be investigated more thoroughly by clicking on the runs link in the right.
The Runs link takes the user to a list of runs in the current IPTS as shown in Figure 3. If you want to see a different experiment simply replace the number in the hyperlink with the desired proposal.
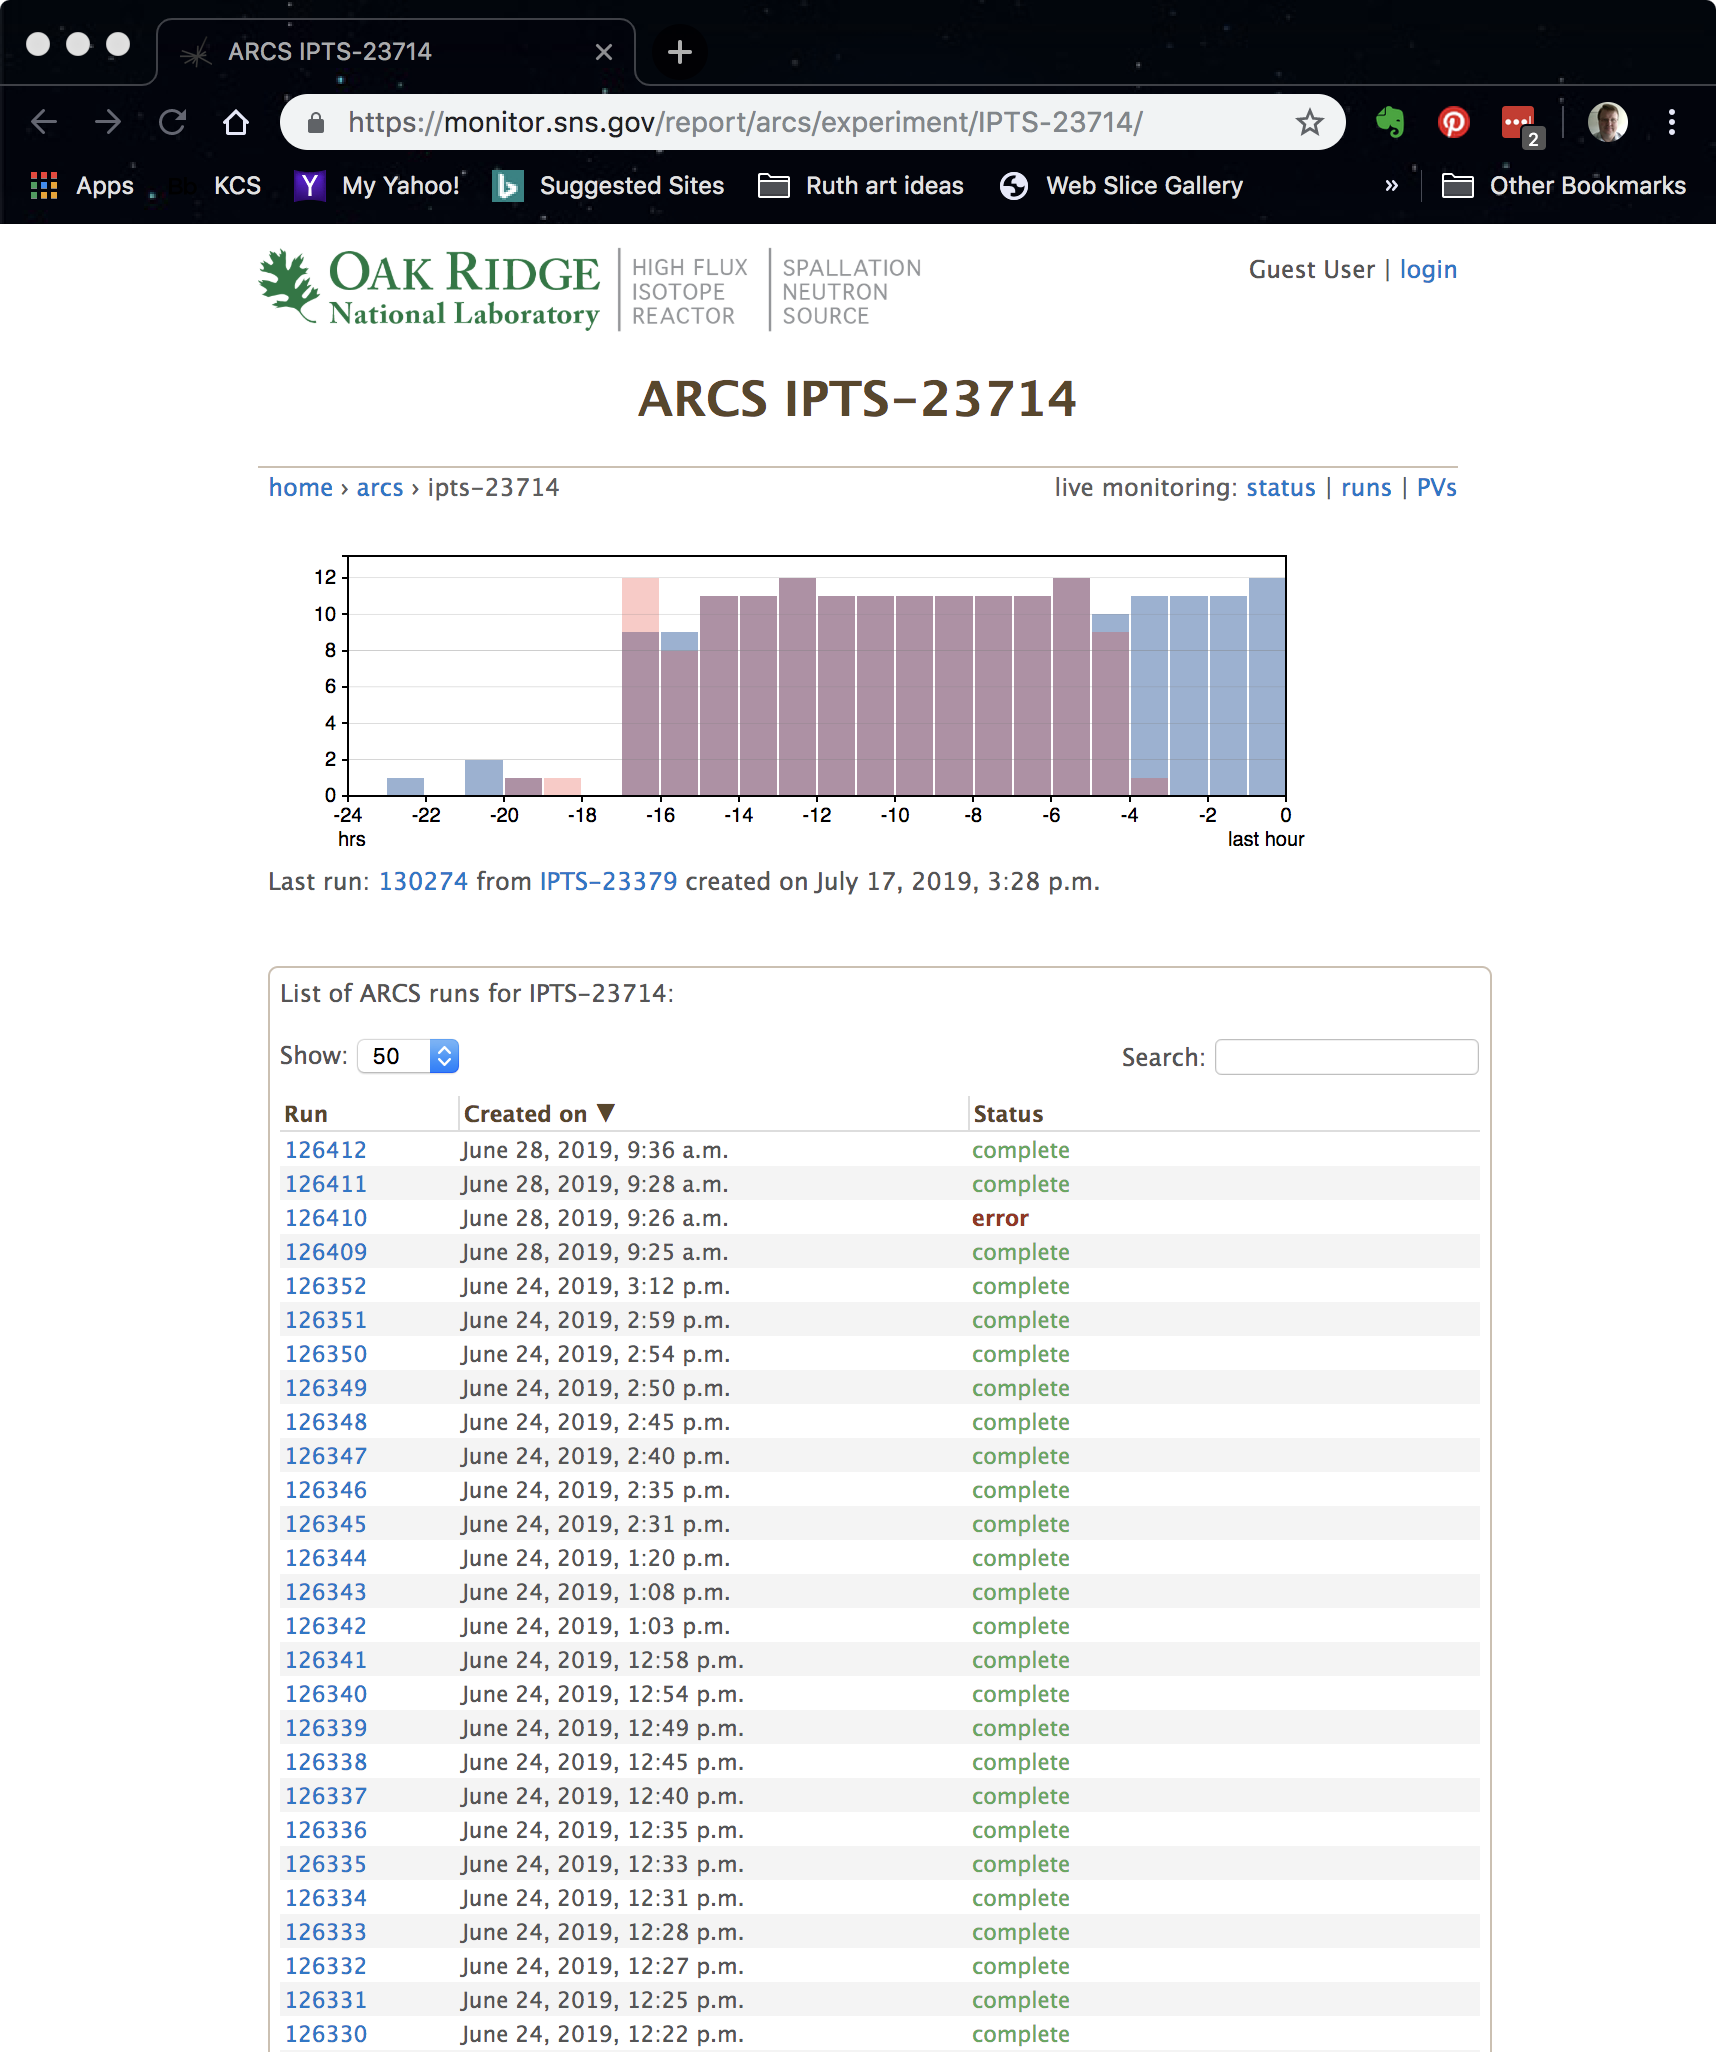 Figure 3. the Runs view from monitor.sns.gov
Alternatively the PVs link allows the user to examine the status of various metadata variables as shown in Figure 4.
If the user clicks on any PV, for example BL18:SE:SampleTemp A window showing the last fiew minutes of that log value are shown.
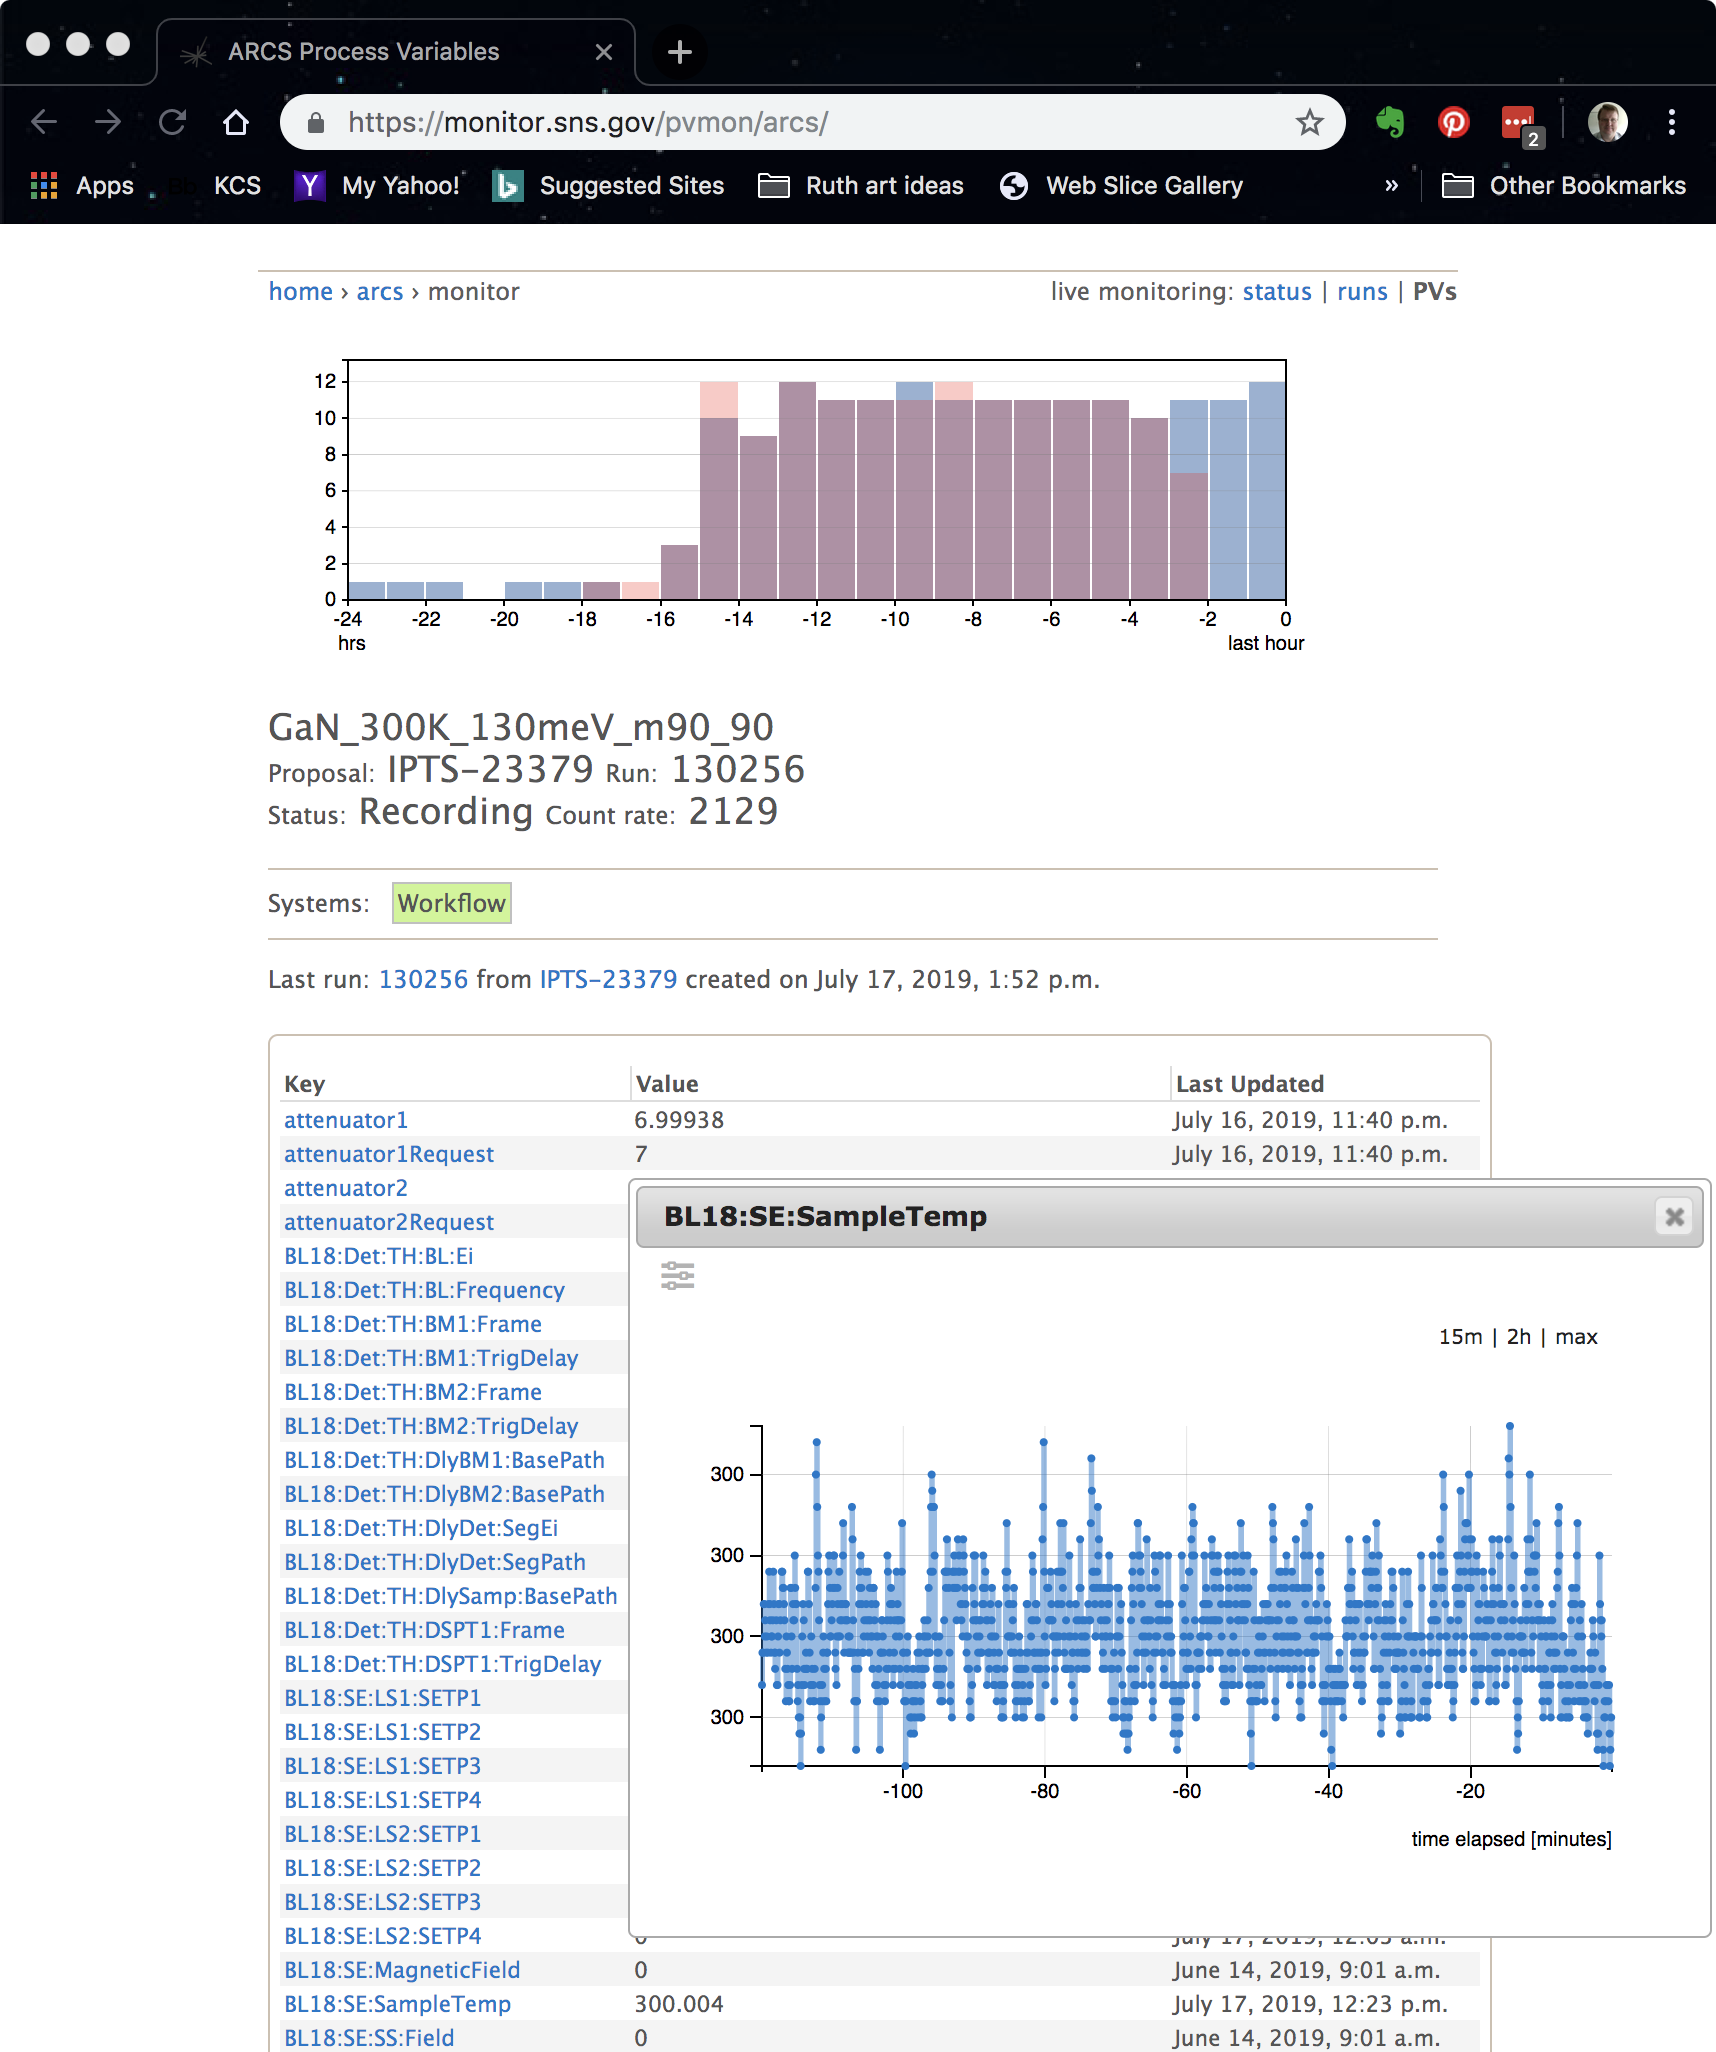
Figure 4. A view of the web monitor after the sample temperature link is selected.
If you are a user for the IPTS on the runs view in Figure 3, you can click on a run to see more information. In order to verify you are on the proposal you need to login with your XCAMS user name and password using the login link in the upper right.
Once logged in you will see a view like in Figure 5.
- The title and some preliminary information are at the Top
- A view of the autoreduced data is on the screen. If you hover over the data you will see a tool bar that will allow you to zoom and do other simple manipulations to the data.
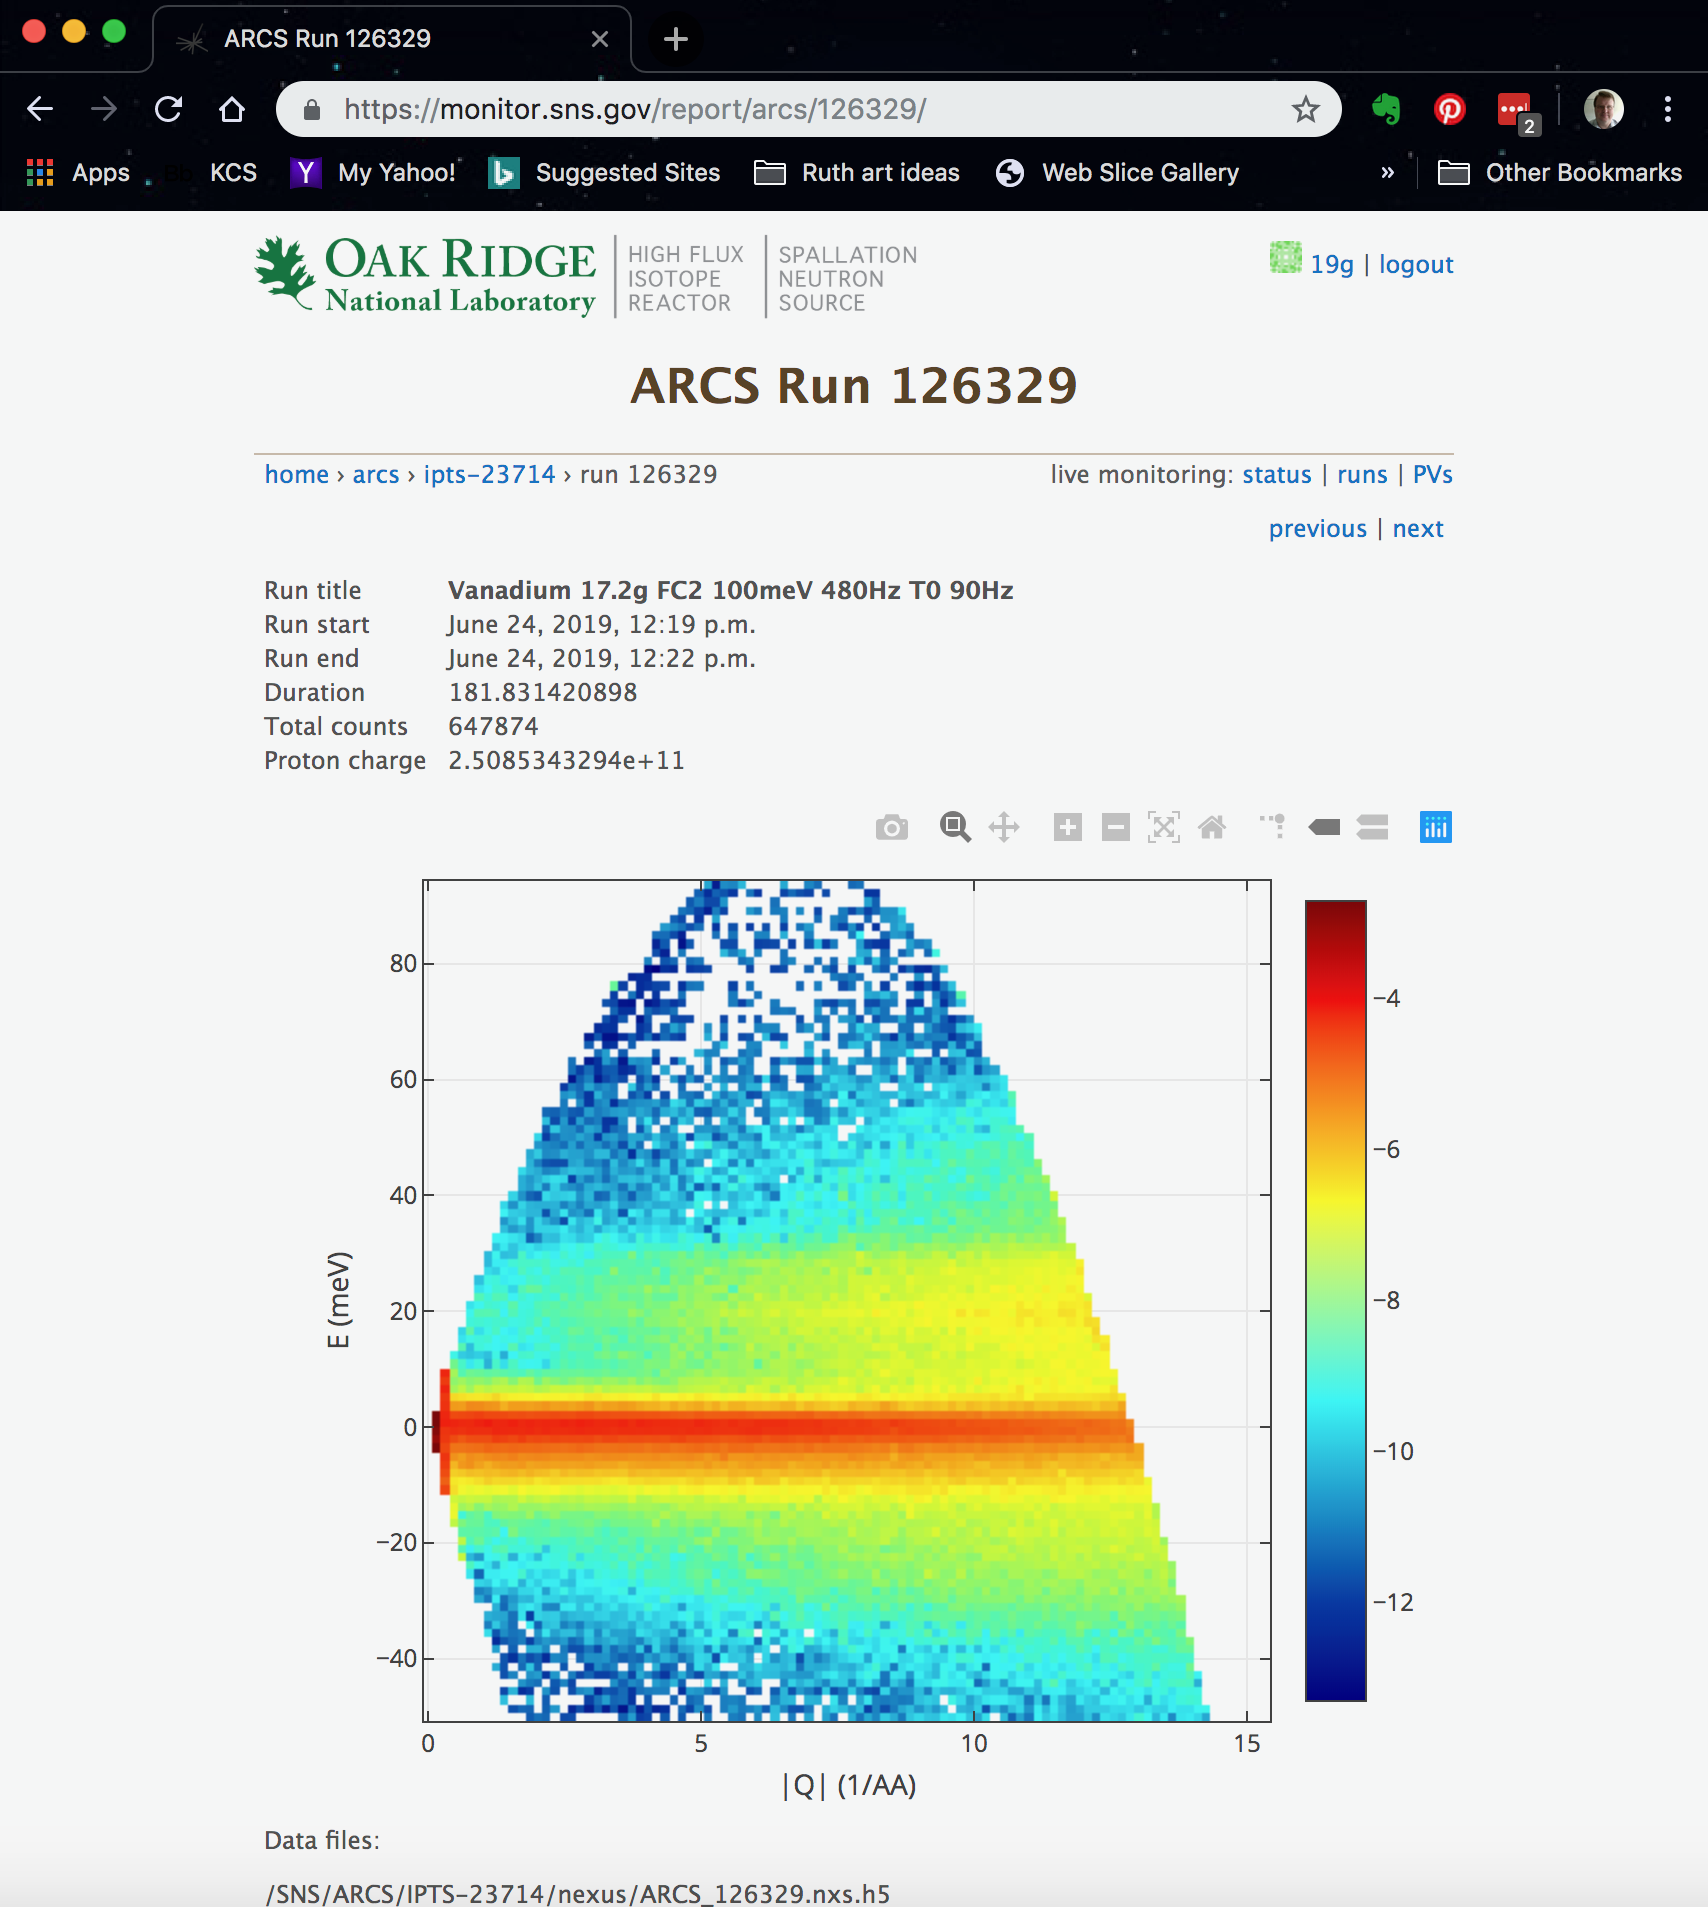
Figure 5.
Mantid Live Listener
If you have something that is changing with time (like glass studies) Mantid provides a live listener to the event stream.
To start the live listener from mantidworkbench go to Load in the upper right hand of the screen and us the arrow to select the Live Data option
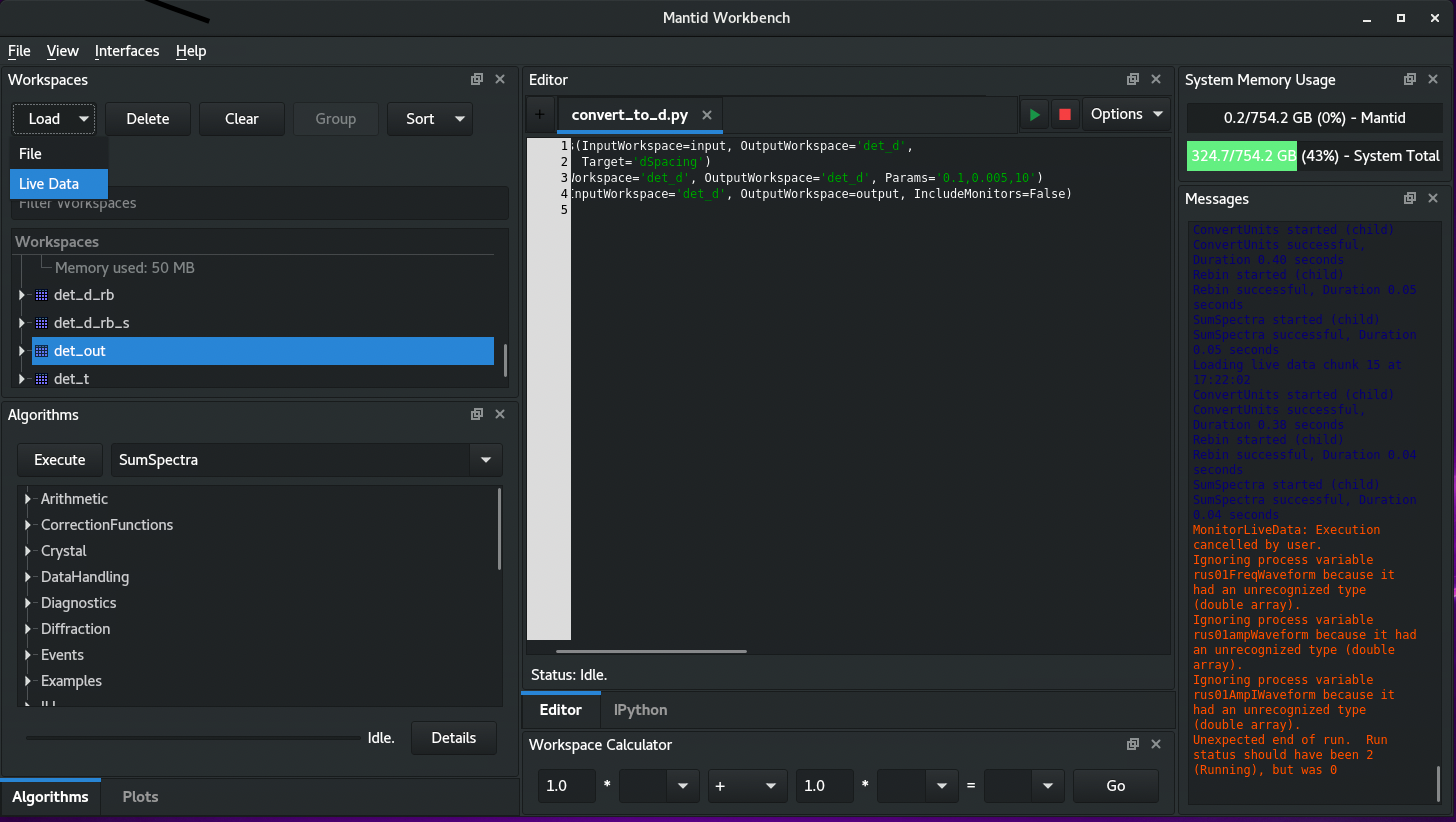
This will pop up the following screen.
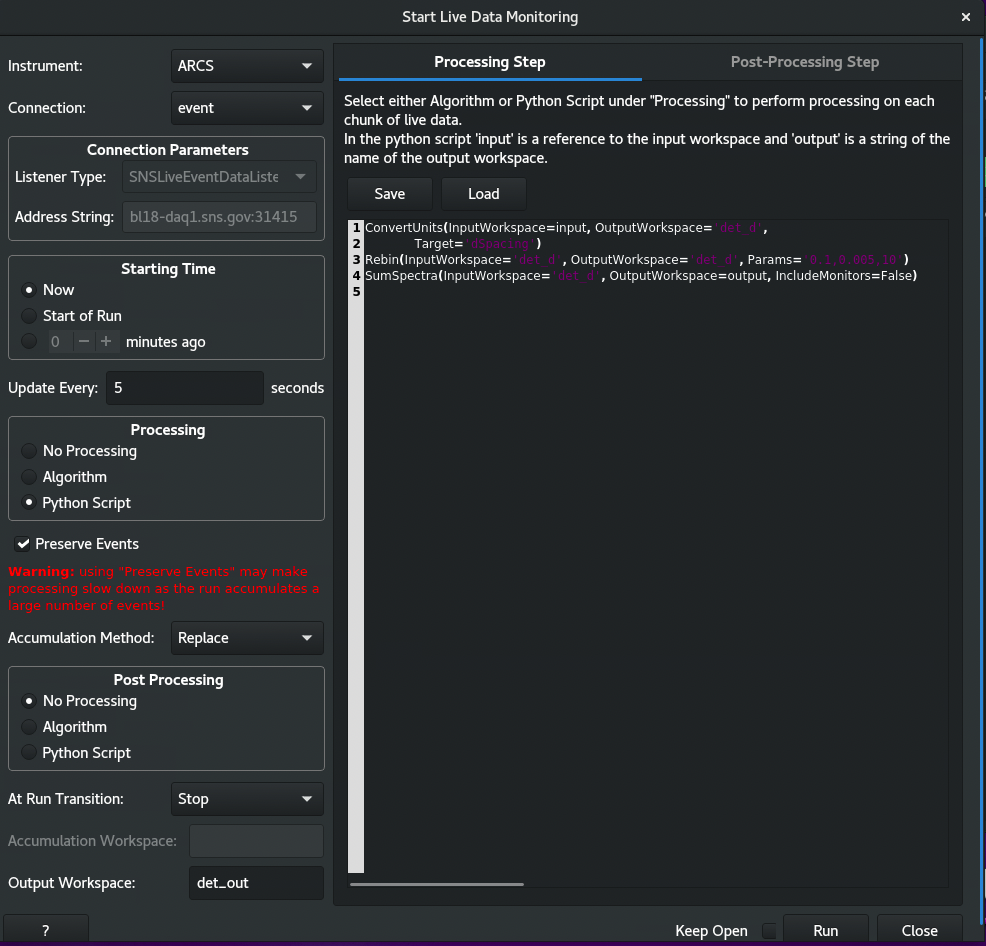
Here
- be sure the instrument is selected correctly
- starting time should be Now
- Select an update time 5-30 seconds is reasonable.
- processing should be a script which will be described shortly.
- the Preserve Events box is checked.
- mark the Post Processing as No processing
- Give an output workspace.
- Accumulation methods should be replace
- At run transition should be stop
Scripts to process the data are located in: /SNS/ARCS/shared/Live_data
The current script is to be used on the events and it provides a single d spacing plot. It is called convert_to_d.py
modify the Params in the Rebin command to match your sample.
